A roadmap describing the required skills, learning resources and sample tools to become an AI Engineer
关键参数与规格
关键参数与规格
参数
值
语言
JavaScript
类别
Tutorials
子类别
ML/AI fundamentals
关键词
Visualization
星标数
687
分叉数
78
贡献者
1
创建日期
2025-10-11
更新日期
2026-10-14
1 天星标数
0
7 天星标数
5
排名
14,990
上次排名
4,343
排名变化
-10,647
7 天星标排名
5,729
上次 7 天星标排名
5,757
7 天星标排名变化
28
总星标排名
15,094
上次总星标排名
15,061
总星标排名变化
-33
README 摘录
MNIST MLP Visualizer Interactive web visualisation for a compact multi-layer perceptron trained on the MNIST handwritten digit dataset. Draw a digit, watch activations propagate through the network in 3D, and inspect real-time prediction probabilities. WIP This is still in a rough state and under active development. If you want something useable for a museum etc check back later. I have a couple of features in mind (like being able to connect a tablet to draw a number) to
make this a good educational visualisation. – Default weights with timeline snapshots (generated from the latest training run). – PyTorch helper to train the MLP (with Apple Metal acceleration when available) and export weights for the front-end. (Only for training) **Install Python dependencies** (PyTorch + torchvision): 2. **Launch a static file server** from the repository root (any server works; this example uses Python): 3. Draw on the 28×28 grid (left-click to draw, right-click to erase) and explore the 3D
network with the mouse or trackpad. Training & Exporting New Weights trains a small MLP on MNIST and writes a JSON export the front-end consumes. Metal (MPS) is used automatically when available on Apple Silicon; otherwise the script falls back to CUDA or CPU. Typical usage: Key options: : Hidden layer sizes (default ). Keep the network modest so the visualisation stays responsive. The script will automatically extend the run so the timeline hits the 50× dataset milestone. By default the script
picks the best available backend. : Export the randomly initialised weights without running training (useful for debugging the pipeline). After training, update in if you export to a different location/name. Refresh the browser to load the new weights. Training timeline export Every exported JSON now includes a array spanning 35 checkpoints: densely spaced early snapshots (≈50, 120, 250, 500, 1k, 2k, 3. 5k, 40k images), followed by dataset-multiple milestones from 1× through 50×. The JSON manifest stays small; each
snapshot’s weights are stored separately as float16-encoded files under , and the front-end streams them on demand so you can scrub the timeline without downloading the entire 50× run up front. Re-export the weights with the updated script to generate fresh timeline data for your own runs. Notes & Tips The visualiser highlights the top-N (configurable) strongest incoming connections per neuron to keep the scene legible. Colors encode activation sign and magnitude (cool tones for negative/low
, warm tones for strong positive contributions). The default export ( ) already includes timeline milestones from a multi-epoch training run. Retrain (and re-export) if you want to showcase a different progression. If you adjust the architecture, ensure the JSON export reflects the new layer sizes; the front-end builds the scene dynamically from that metadata. Deployment Keep production files under the repo-local tree (ideal for on the new host): – files served by nginx. – immutable snapshots for quick rollback (each
stamped with the commit hash in ). From the repo root run: When no commit is supplied it deploys . The script
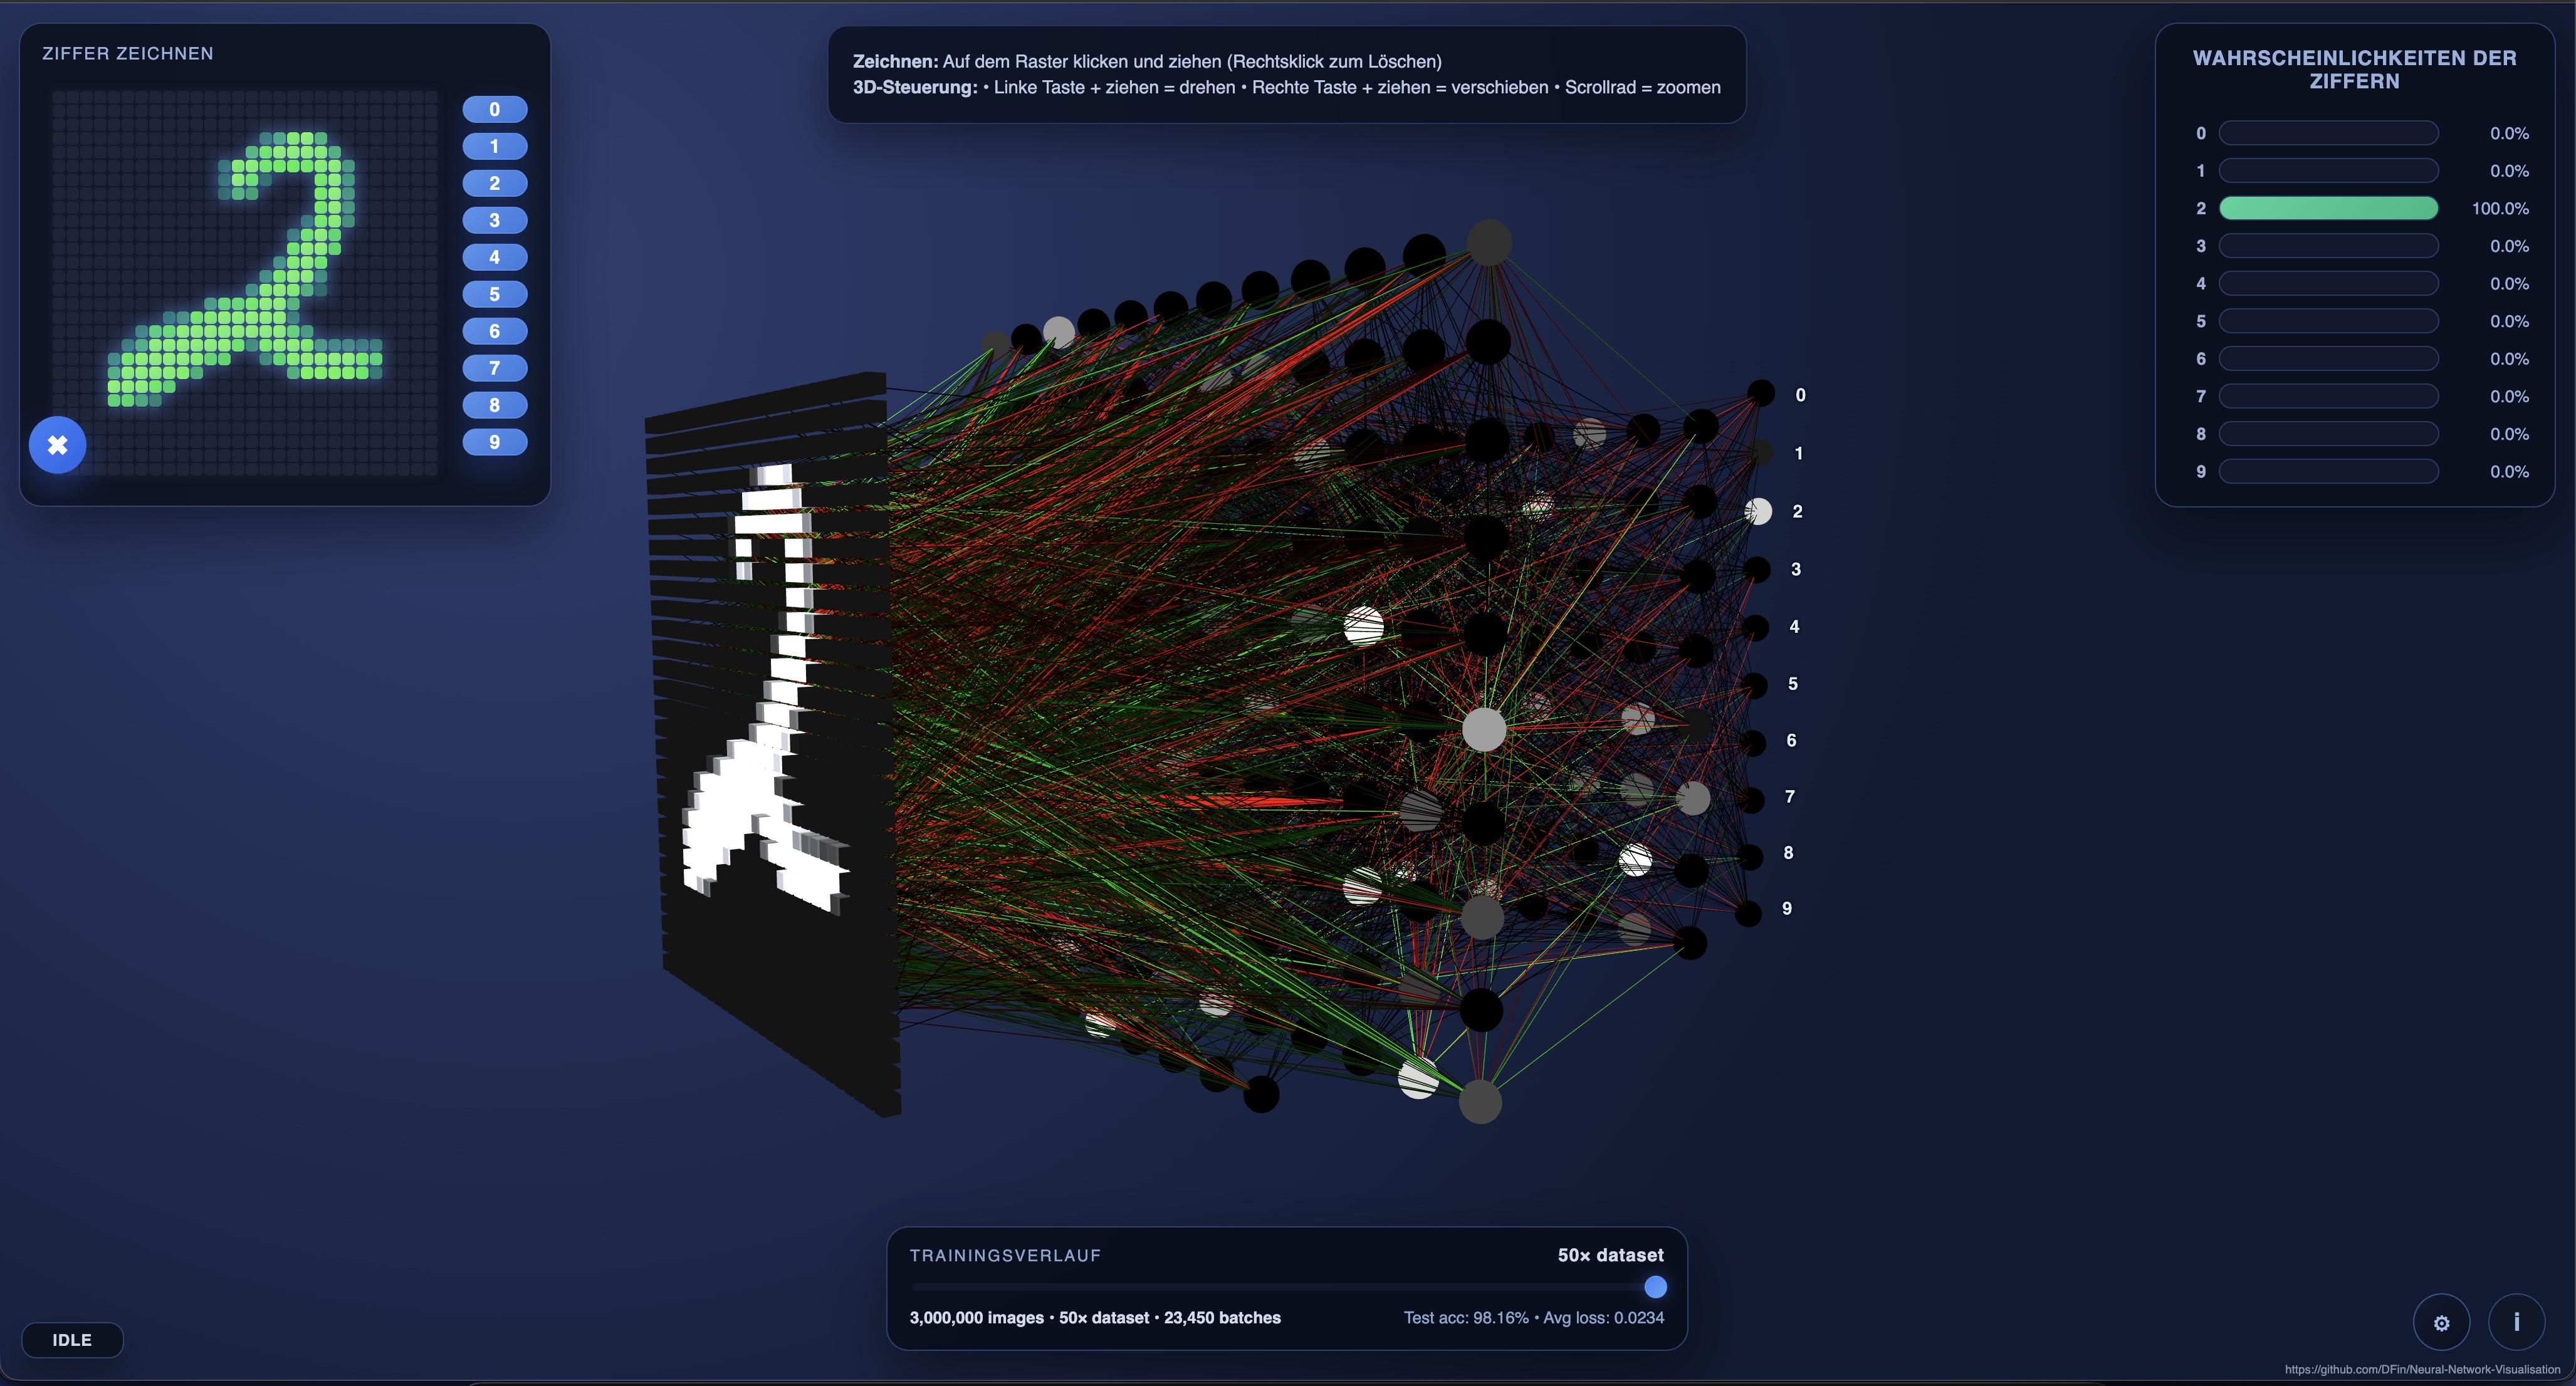
Interactive web visualisation for a compact multi-layer perceptron trained on the MNIST handwritten digit dataset. Draw a digit, watch activations propagate through the network in 3D, and inspect real-time prediction probabilities.
WIP
This is still in a rough state and under active development. If you want something useable for a museum etc check back later. I have a couple of features in mind (like being able to connect a tablet to draw a number) to make this a good educational visualisation.
Repository Layout
index.html / assets/ – Static Three.js visualiser and UI assets.
exports/mlp_weights.json – Default weights with timeline snapshots (generated from the latest training run).
training/mlp_train.py – PyTorch helper to train the MLP (with Apple Metal acceleration when available) and export weights for the front-end.
Quick Start
(Only for training) Install Python dependencies (PyTorch + torchvision):
python3 -m pip install torch torchvision
Launch a static file server from the repository root (any server works; this example uses Python):
python3 -m http.server 8000
Open http://localhost:8000 in your browser. Draw on the 28×28 grid (left-click to draw, right-click to erase) and explore the 3D network with the mouse or trackpad.
Training & Exporting New Weights
training/mlp_train.py trains a small MLP on MNIST and writes a JSON export the front-end consumes. Metal (MPS) is used automatically when available on Apple Silicon; otherwise the script falls back to CUDA or CPU.
--hidden-dims: Hidden layer sizes (default 128 64). Keep the network modest so the visualisation stays responsive.
--epochs: Minimum training epochs (default 5). The script will automatically extend the run so the timeline hits the 50× dataset milestone.
--batch-size: Mini-batch size (default 128).
--device: Force mps, cuda, or cpu. By default the script picks the best available backend.
--skip-train: Export the randomly initialised weights without running training (useful for debugging the pipeline).
After training, update VISUALIZER_CONFIG.weightUrl in assets/main.js if you export to a different location/name. Refresh the browser to load the new weights.
Training timeline export
Every exported JSON now includes a timeline array spanning 35 checkpoints: densely spaced early snapshots (≈50, 120, 250, 500, 1k, 2k, 3.5k, 5.8k, 8.7k, 13k, 19.5k, 28.5k, 40k images), followed by dataset-multiple milestones from 1× through 50×. The JSON manifest stays small; each snapshot’s weights are stored separately as float16-encoded files under exports//NNN_.json, and the front-end streams them on demand so you can scrub the timeline without downloading the entire 50× run up front. Re-export the weights with the updated script to generate fresh timeline data for your own runs.
Notes & Tips
The visualiser highlights the top-N (configurable) strongest incoming connections per neuron to keep the scene legible.
Colors encode activation sign and magnitude (cool tones for negative/low, warm tones for strong positive contributions).
The default export (exports/mlp_weights.json) already includes timeline milestones from a multi-epoch training run. Retrain (and re-export) if you want to showcase a different progression.
If you adjust the architecture, ensure the JSON export reflects the new layer sizes; the front-end builds the scene dynamically from that metadata.
Deployment
Keep production files under the repo-local releases/ tree (ideal for /srv/server/nn-vis on the new host):
releases/current/ – files served by nginx.
releases/backups// – immutable snapshots for quick rollback (each stamped with the commit hash in .commit).
releases/.deploy_tmp/ – staging area used during deployment.
From the repo root run:
./deploy.sh [commit-ish]
When no commit is supplied it deploys HEAD. The script exports the requested commit, stages it under .deploy_tmp/, then rsyncs into releases/current/ and a timestamped backup. Point nginx at the current directory, e.g.:
server {
    server_name nn-vis.noelith.dev;
    root /srv/server/nn-vis/releases/current;
    index index.html;
    location / {
        try_files $uri $uri/ /index.html;
    }
}
Issue TLS certs via certbot --nginx -d nn-vis.noelith.dev once the site block is enabled.