AgentSight: System-wide AI agent profiling and monitoring with eBPF


English | 中文
AI agents can run commands, rewrite files, spawn processes, and contact remote services—but when a run fails, stalls, or behaves unexpectedly, their logs rarely tell the whole story.
AgentSight is a local-first top/strace-like observability tool for AI agents. It connects prompts, model calls, and tool decisions to their real effects on your machine.
- See what the agent is doing now. Monitor active sessions, processes, resource, model and tool calls, file and network activity.
- Understand failures and improve agent behavior. Connect prompts and skills to errors, then turn them into better instructions and skills.
- Find where time, tokens, and resources go. Spot slow steps, retry loops, repeated model or tool calls, token-heavy sessions, and resource-hungry processes.
- Audit data movement and security-sensitive effects. See which services received requests, which files changed, and whether agents stayed and give safety/security suggestions.
- Use it with your existing agents. Run AgentSight around Claude Code, Codex, Gemini CLI, OpenCode, OpenClaw, or any command—without an SDK, proxy, or vendor integration.
No SDK, no proxy, no vendor integration. AgentSight observes with eBPF and TLS traffic tracing, so it works even when the agent is a closed-source CLI. ✨ Zero SDK Required
Quick Start
cargo install agentsight
# or: wget https://github.com/eunomia-bpf/agentsight/releases/latest/download/agentsight && chmod +x agentsight
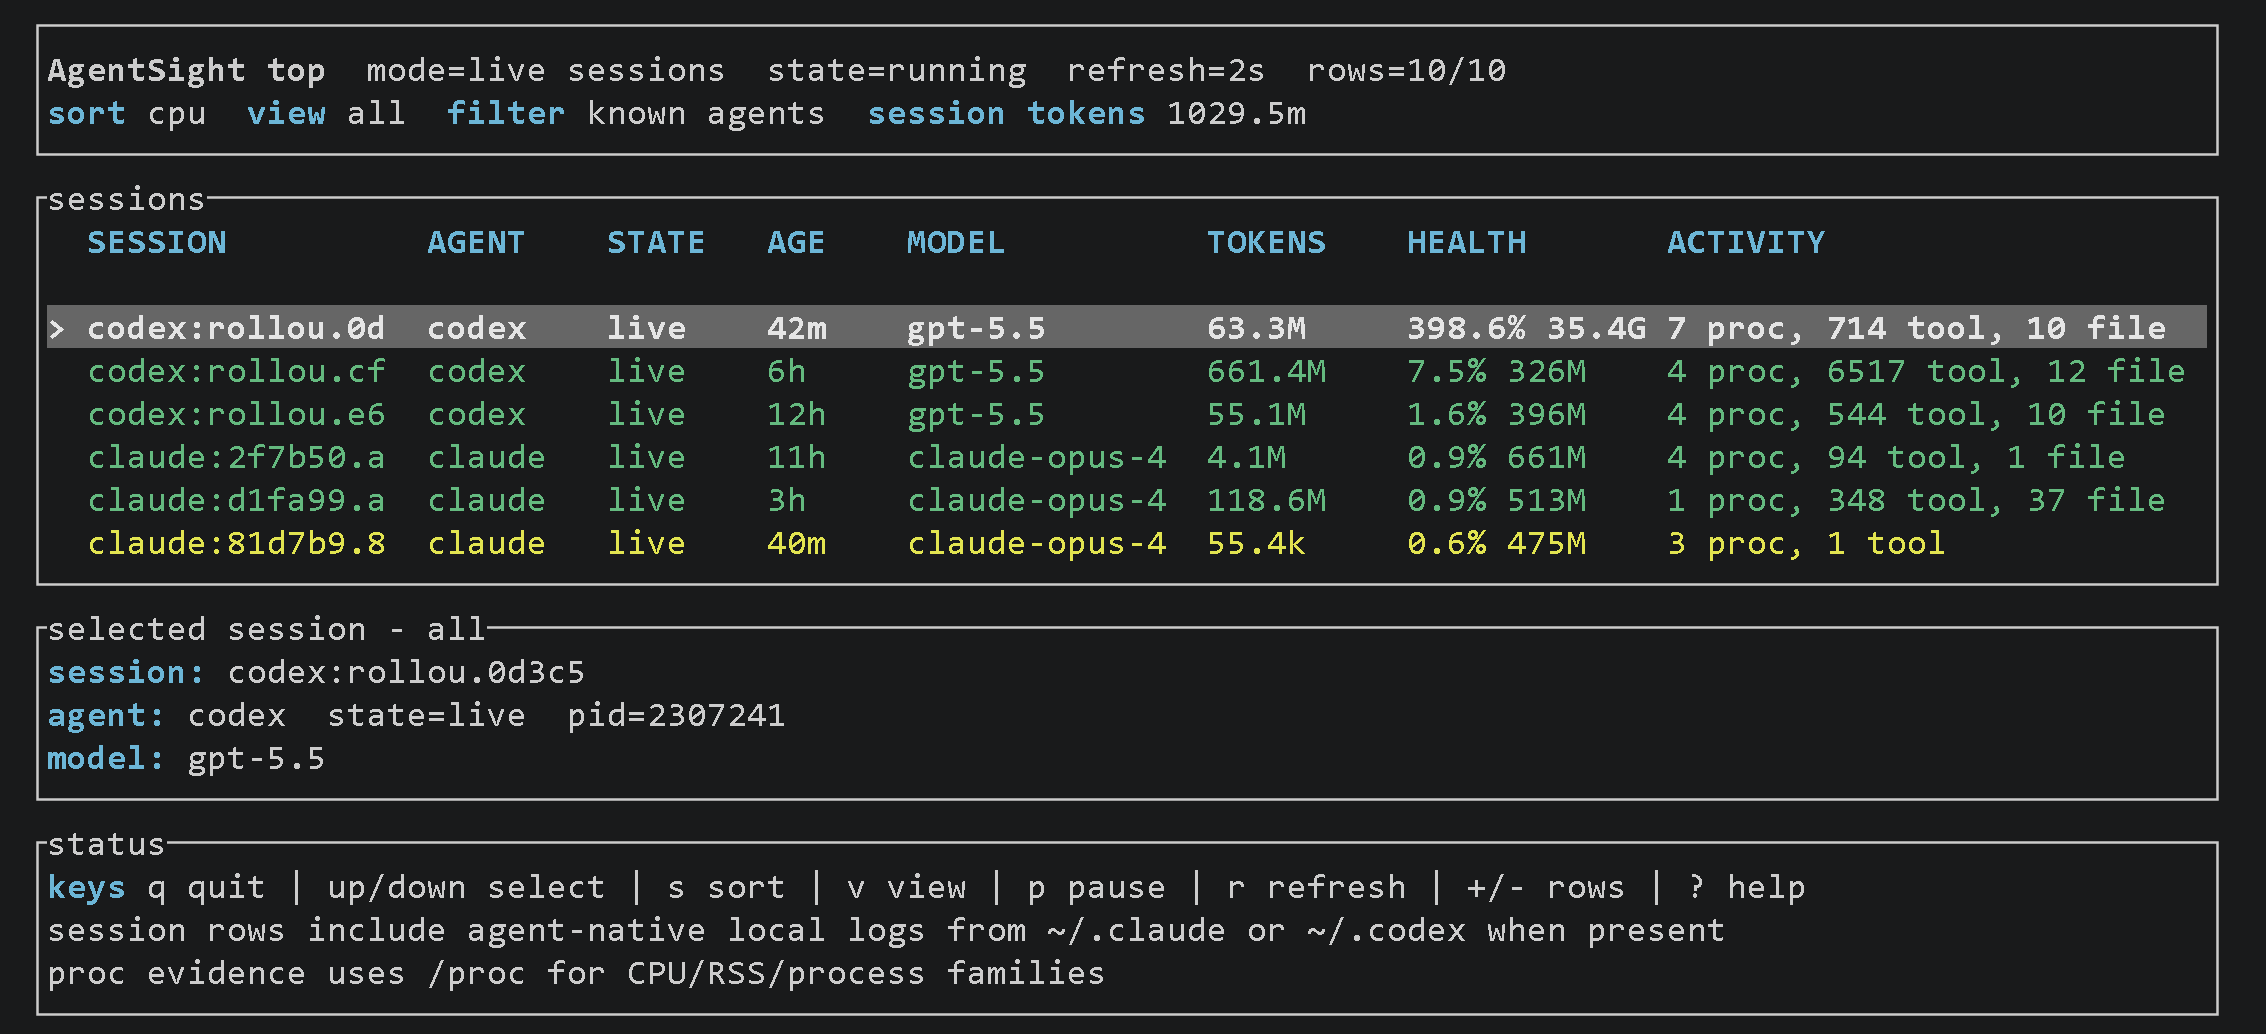
Live sessions ranked by model, session tokens, health, process family, tool calls, file activity, and network activity
agentsight top

Agent Nebula replays how coding agents read, write, create, rename, and delete files across the ACTplane repository
agentsight vis

Width is system-effect weight; the uneven stack height shows prompt, tool-call, process, and effect paths ending at different depths. See the agentpprof guide for the other profiles and how widths and stack depths are drawn.
🚀 Why AgentSight?
Traditional Observability vs. System-Level Monitoring
Application-level tools such as LangSmith, Langfuse, and Phoenix are great for traces, prompts, tokens, evals, and latency when you own the application code. Gateway/proxy tools such as Helicone are useful when you can route provider traffic through a managed endpoint.
AgentSight focuses on the layer those tools often miss: what the agent actually does at the system boundary. It observes existing binaries and CLI agents without SDKs or proxies, then correlates LLM traffic with process execution, file access, and system activity.
| Challenge | Application-Level Tools | AgentSight Solution |
|---|---|---|
| Framework Adoption | ❌ SDK, callback, or gateway integration per app | ✅ Drop-in system tracer, no code changes |
| Closed-Source CLIs | ❌ Limited to what the tool exposes or logs | ✅ Observes existing binaries and CLI agents from outside |
| Agent-Controlled Logs | ❌ Logs can be incomplete, disabled, or modified | ✅ Kernel-level events independent of app logging |
| TLS LLM Traffic | ❌ Visible when routed through SDKs/proxies | ✅ Captures plaintext at SSL/TLS calls without a proxy |
| System Actions | ❌ Often misses subprocesses and local file activity | ✅ Tracks process execution, file access, and resource use |
| Cross-Boundary Behavior | ❌ Traces usually stop at framework/process boundaries | ✅ Correlates LLM traffic with process and file events |
AgentSight captures critical interactions that application-level tools miss:
- Subprocess executions that bypass instrumentation
- Plaintext LLM payloads at SSL/TLS call boundaries
- File operations and system resource access
- Cross-boundary behavior across LLM, process, and file events
Usage
Prerequisites
- Windows, macOS, or Linux:
top,bind,vis, andreportcan use agent-native session files without eBPF - Linux kernel: 4.1+ with eBPF support (5.0+ recommended) for
recordand the eBPF-backed debug commands - sudo access on Linux: optional for
top; eBPF is enabled automatically when sudo is already available
For source builds, see docs/build.md.
Rust Library
Rust applications can depend on
agentsight-capture to reuse the
same eBPF runners, agent-native sources, analyzers, event model, materialized
view, and sinks as the agentsight binary. The CLI is published separately as
the agentsight package and is the library's primary consumer.
Installation
Homebrew on Linux
brew tap eunomia-bpf/tap
brew install eunomia-bpf/tap/agentsight
agentsight --version
The current Homebrew formula supports Linux x86-64.
Cargo or Release Binary
For local use, install with cargo install agentsight or download the latest
release binary, then start with agentsight top. Use the examples below when
you want to record a specific command or inspect saved sessions.
GitHub releases provide agentsight-x86_64 and agentsight-aarch64 for Linux.
The unsuffixed agentsight asset remains an x86_64 compatibility alias.
Native Windows builds are exercised by the Windows CI workflow; until a Windows
release asset is published, download its agentsight-windows-x86_64 artifact or
build the collector crate from source.
For Linux and Windows installation, background monitoring, Node binding, automatic startup, upgrades, and removal, see Installation and Automatic Startup.
Docker
Docker is useful for container, CI, or isolated Linux environments, but it still needs privileged host access for eBPF. See docs/docker.md.
Build from Source
Build requirements and source build commands live in docs/build.md.
Replay a Repository Session
Run agentsight vis inside a Git worktree. It scans matching local Claude,
Codex, and Gemini sessions without sudo, then writes an animated replay to
output/agent-nebula.gif:
cd your-repository
agentsight vis
GIF export requires local Chromium and FFmpeg. Use
agentsight vis -o output/agent-nebula.html for a self-contained HTML artifact
that needs neither dependency to generate.
Querying Past Sessions
Every record session is automatically saved to an agentsight-*.db SQLite
file in the current directory. Start with the live and record commands, then
use agentsight report for structured queries:
agentsight top                               # live ranked view; uses eBPF when sudo is already available
agentsight monitor install-service           # install/start the background monitor service
agentsight report --db run.db                 # summary of a specific saved run
sudo agentsight record -- claude             # record a command
agentsight report                            # high-level latest-run summary (default)
agentsight report list                       # recorded sessions in this directory
agentsight report prompts --json             # full LLM request/response JSON
agentsight report token                      # token usage from latest DB, or local agent sessions
agentsight report token --group-by dir       # token usage by session/process working directory
agentsight report audit --json               # process spawns, file opens, API calls
agentsight report serve                      # open the web UI for the latest session in this directory
agentsight report export -o snapshot.json    # export for web dashboard; see docs/snapshot-schema.md
agentsight report --local                    # summarize native Claude/Codex/Gemini sessions
On supported Linux kernels, process FILE_OPEN events include resolved paths,
read/write/exec access, and overlay layer and inode metadata. See the
process probe reference for the JSON
fields and older-kernel fallback.
Offline Agent pprof Profiles
Use agentpprof when you want a no-sudo pprof/folded-stack/SVG summary of
local Codex or Claude session history:
cargo run --manifest-path ext/pprof/Cargo.toml -- \
  --project-root . \
  --view tokens \
  -o agent.pb.gz

go tool pprof -top agent.pb.gz
The tokens view is the best first flamegraph for cost analysis: it aggregates
real local Codex/Claude development sessions by project, agent, session tag,
prompt tag, model, and token kind.

Offline token profile generated from real local bpf-benchmark coding-agent sessions
See ext/pprof/README.md for CLI details and the agentpprof profiling guide for flamegraph examples, rendering, view selection, and deterministic tagging rules.
Web Interface
During a session, visit http://127.0.0.1:7395 for live traffic, process trees, and metrics:
- Overview Dashboard (landing): http://127.0.0.1:7395/ — tokens, model calls, process/file/network effects, resource shape, and friction signals for the whole session, with drill-down into the detail views.
- Timeline View: http://127.0.0.1:7395/timeline
- Process Tree: http://127.0.0.1:7395/tree
- Event Log: http://127.0.0.1:7395/logs
- Metrics View: http://127.0.0.1:7395/metrics
For a saved SQLite session, run agentsight report serve --db run.db and open the same routes.
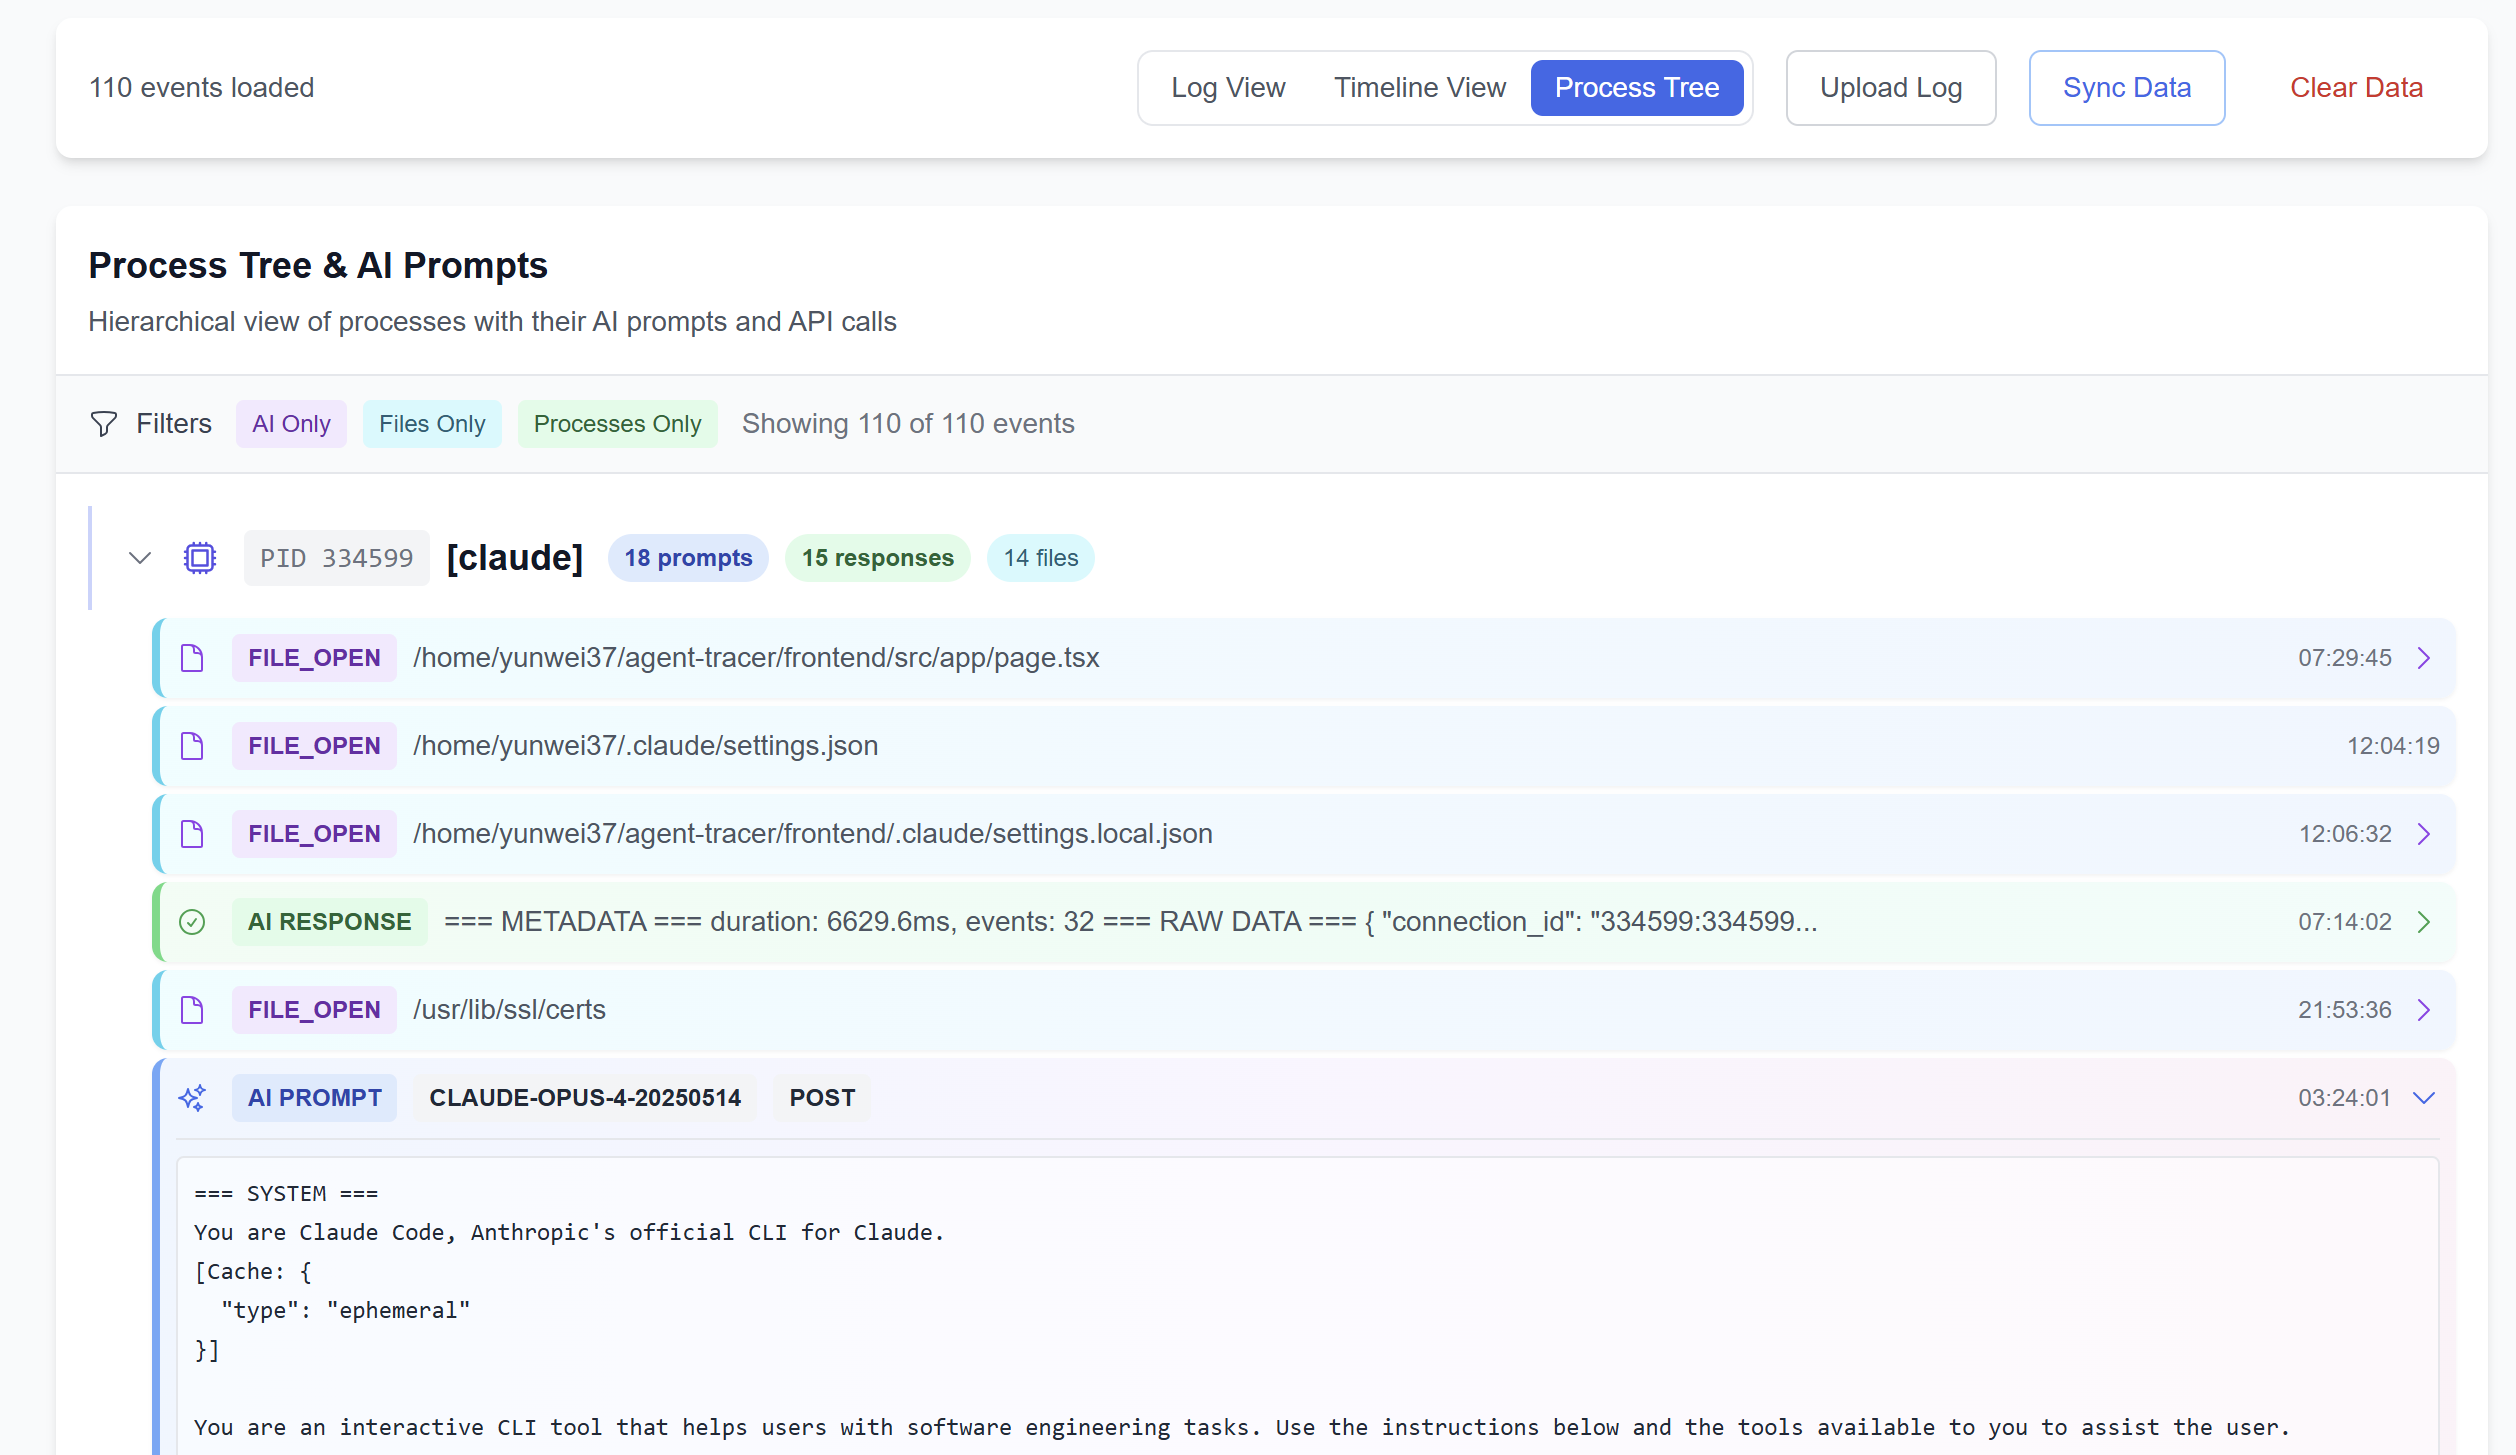
Process tree visualization for agent subprocesses and file activity
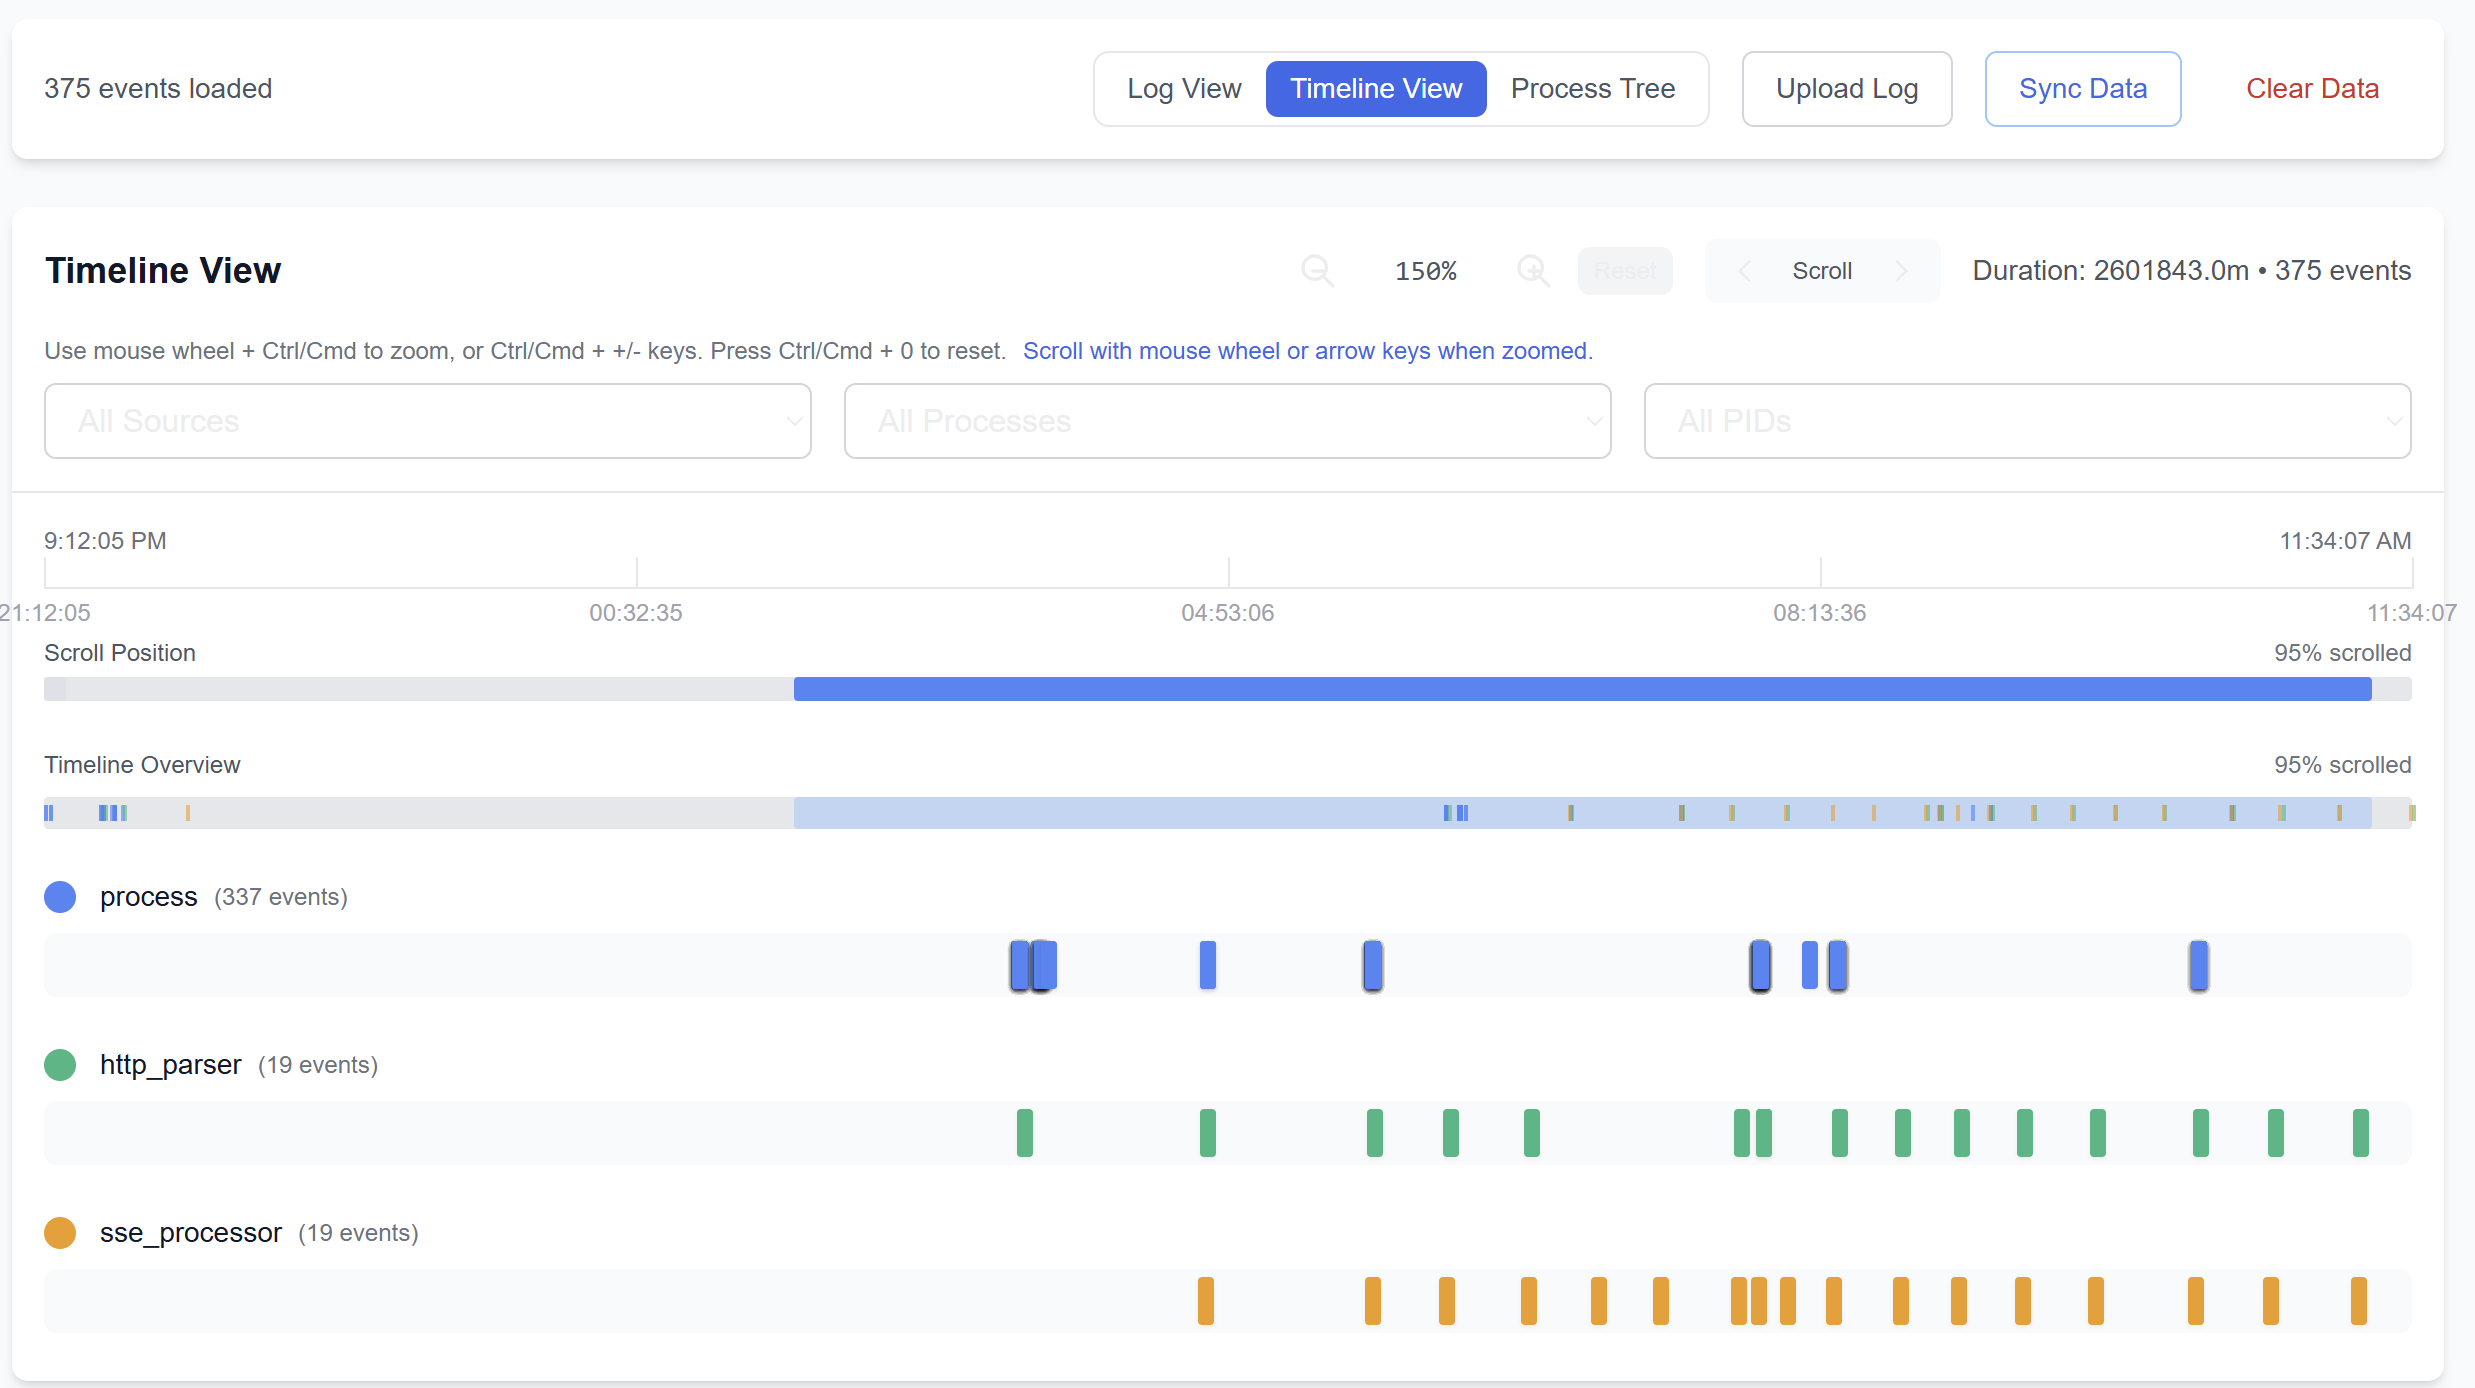
Timeline visualization for LLM, process, file, and network events
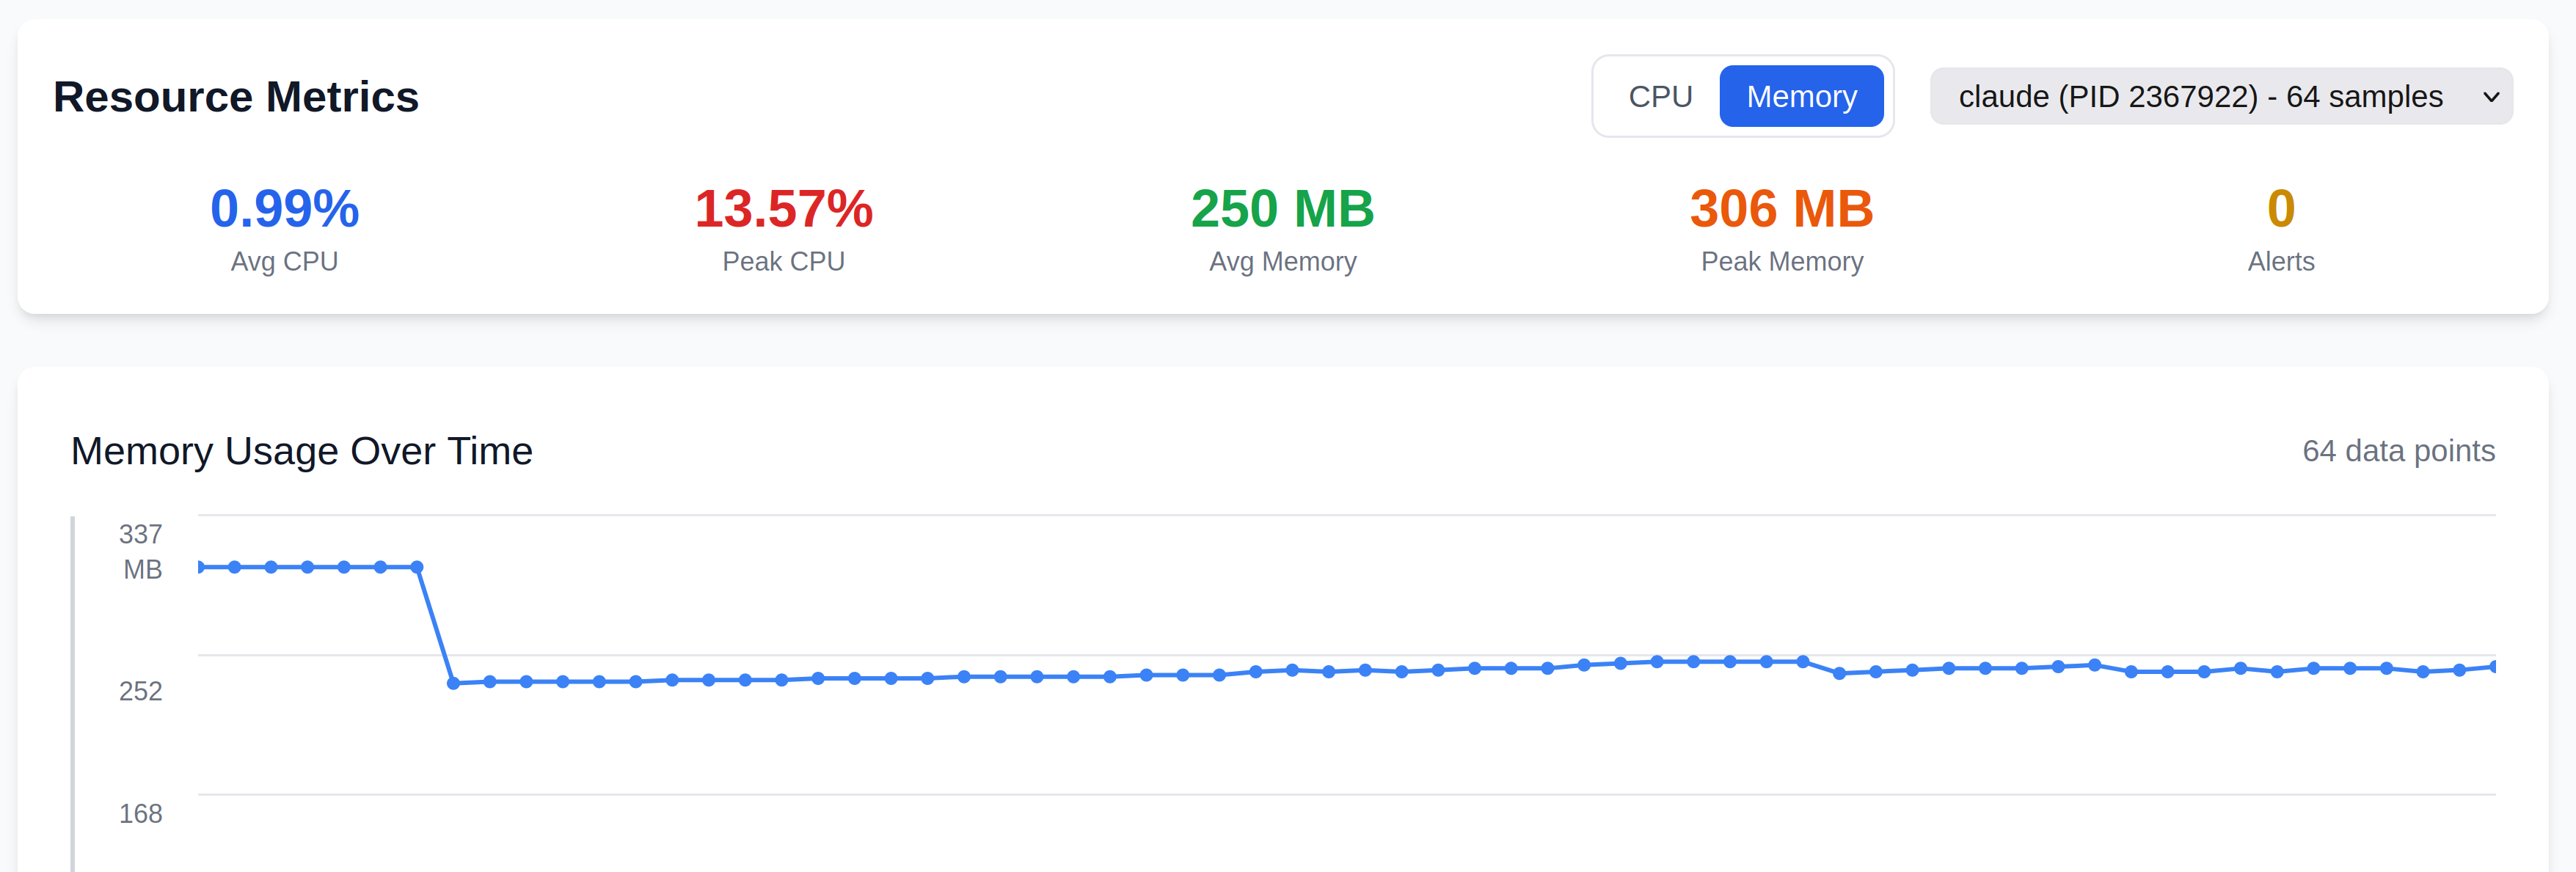
Metrics visualization for memory and CPU usage
Try the live demo to explore a real recorded Claude Code session in the browser.
Supported Agents
Privileges: eBPF probes need root. Use
sudofor live capture commands.
record auto-discovers binaries, SSL libraries, and container processes. Works out of the box for:
| Agent | Command |
|---|---|
| Claude Code | sudo ./agentsight record -- claude |
| Gemini CLI | sudo ./agentsight record -- gemini |
| Kimi Code | sudo ./agentsight record -- kimi |
| Grok Build | sudo ./agentsight record -- grok |
| Python (aider, open-interpreter, …) | sudo ./agentsight record -c python |
| Docker containers (OpenClaw, …) | sudo ./agentsight record -c node --binary-path docker://openclaw |
| Cursor (IDE) | agentsight top reads its local sessions, no sudo needed |
| CodeBuddy CLI | agentsight top reads ~/.codebuddy/projects; sudo ./agentsight record -c codebuddy attaches the running Node process |
| Any command | sudo ./agentsight record -- |
See docs/agents.md for agent-specific setup, SSL quirks, browser capture, MCP stdio, and advanced flags.
OpenTelemetry Export
AgentSight can export captured LLM calls as OpenTelemetry GenAI
(gen_ai.*) spans over OTLP/HTTP — standards-compliant agent telemetry for any
agent, with zero in-process instrumentation.
sudo ./agentsight debug trace --otel --otel-endpoint http://localhost:4318
See docs/otel.md for collector setup and backend integration.
❓ Frequently Asked Questions
Q: What permissions does AgentSight need?
A: top uses live eBPF process capture when you run it with sudo or your user already has passwordless/cached sudo. Without eBPF privileges, it falls back to process snapshots and native agent session files. With record -- , the monitored agent still runs as your normal user; only the probes are elevated.
Q: What's the performance impact? A: Our evaluation reports less than 3% CPU overhead for typical traced agent workloads.
Q: Where does captured data go?
A: record stores sessions as agentsight-*.db files in the current directory by default, and report reads the latest matching file from that directory unless you pass --db. When no default DB exists, report commands warn and fall back to local Claude/Codex/Gemini agent sessions where available. monitor stores its weekly background DBs under ~/.agentsight/monitor, while top only shows live sessions. Use agentsight report, agentsight report list, agentsight report audit --json, and agentsight report token to inspect prior runs. Captured data can include prompts, responses, paths, headers, and network targets, so treat logs and DBs as sensitive.
Q: Why doesn't AgentSight capture traffic from Claude Code, Node.js, or Gemini CLI?
A: These applications statically link their SSL library (BoringSSL for Claude/Bun, OpenSSL for all Node.js — both NVM and system installs) into their own binary instead of using system libssl.so, so there's nothing for sslsniff to hook by default. AgentSight handles this for you: record -- always discovers the binary, and record -c node now auto-discovers the Node binary too. For Claude attach mode, pass --binary-path. See the "Zero-Config: record" and "Monitoring Node.js AI Tools" sections.
Q: Can AgentSight trace IDE agents like Cursor? A: Not through eBPF. They are Electron apps that mostly run on macOS or Windows, their TLS sits inside a stripped framework binary and a helper process, and Cursor's API traffic is protobuf rather than JSON, so even a successful capture produces no LLM events. Support for these agents goes through the agent-native session path instead. See IDE-Based Agents for the details.
Q: What should I check if tracing fails?
A: Verify you are on Linux with eBPF support, have sudo or CAP_BPF/CAP_SYS_ADMIN, and are using record -- or the correct --binary-path for statically linked agents.
🤝 Contributing
We welcome contributions! After cloning and building (see docs/build.md), you can:
# Run tests
make test

# Frontend development server
cd frontend && npm run dev

# Build debug versions with AddressSanitizer
make -C bpf debug
Key Resources
- CLAUDE.md - Project guidelines and architecture
- docs/design/README.md - archived design notes and research drafts
📄 License
MIT License - see LICENSE for details.
💡 The Future of AI Observability: As AI agents become more autonomous and capable of self-modification, traditional observability approaches become insufficient. AgentSight provides independent, system-level monitoring for safe AI deployment at scale.