featexp
Feature exploration for supervised learning. Helps with feature understanding, identifying noisy features, feature debugging, leakage detection and model monitoring.
Installation
pip install featexp
Using featexp
Detailed Medium post on using featexp. Translations from web: Chinese, Russian
featexp draws plots similar to partial dependence plots, but directly from data instead of using a trained model like current implementations of pdp do. Since it draws plots from data directly, it helps with understanding the features well and building better ML models.
from featexp import get_univariate_plots
get_univariate_plots(data=data_train, target_col='target', data_test=data_test, features_list=['DAYS_EMPLOYED'])

# data_test and features_list are optional.
# Draws plots for all columns if features_list not passed
# Draws only train data plots if no test_data passed
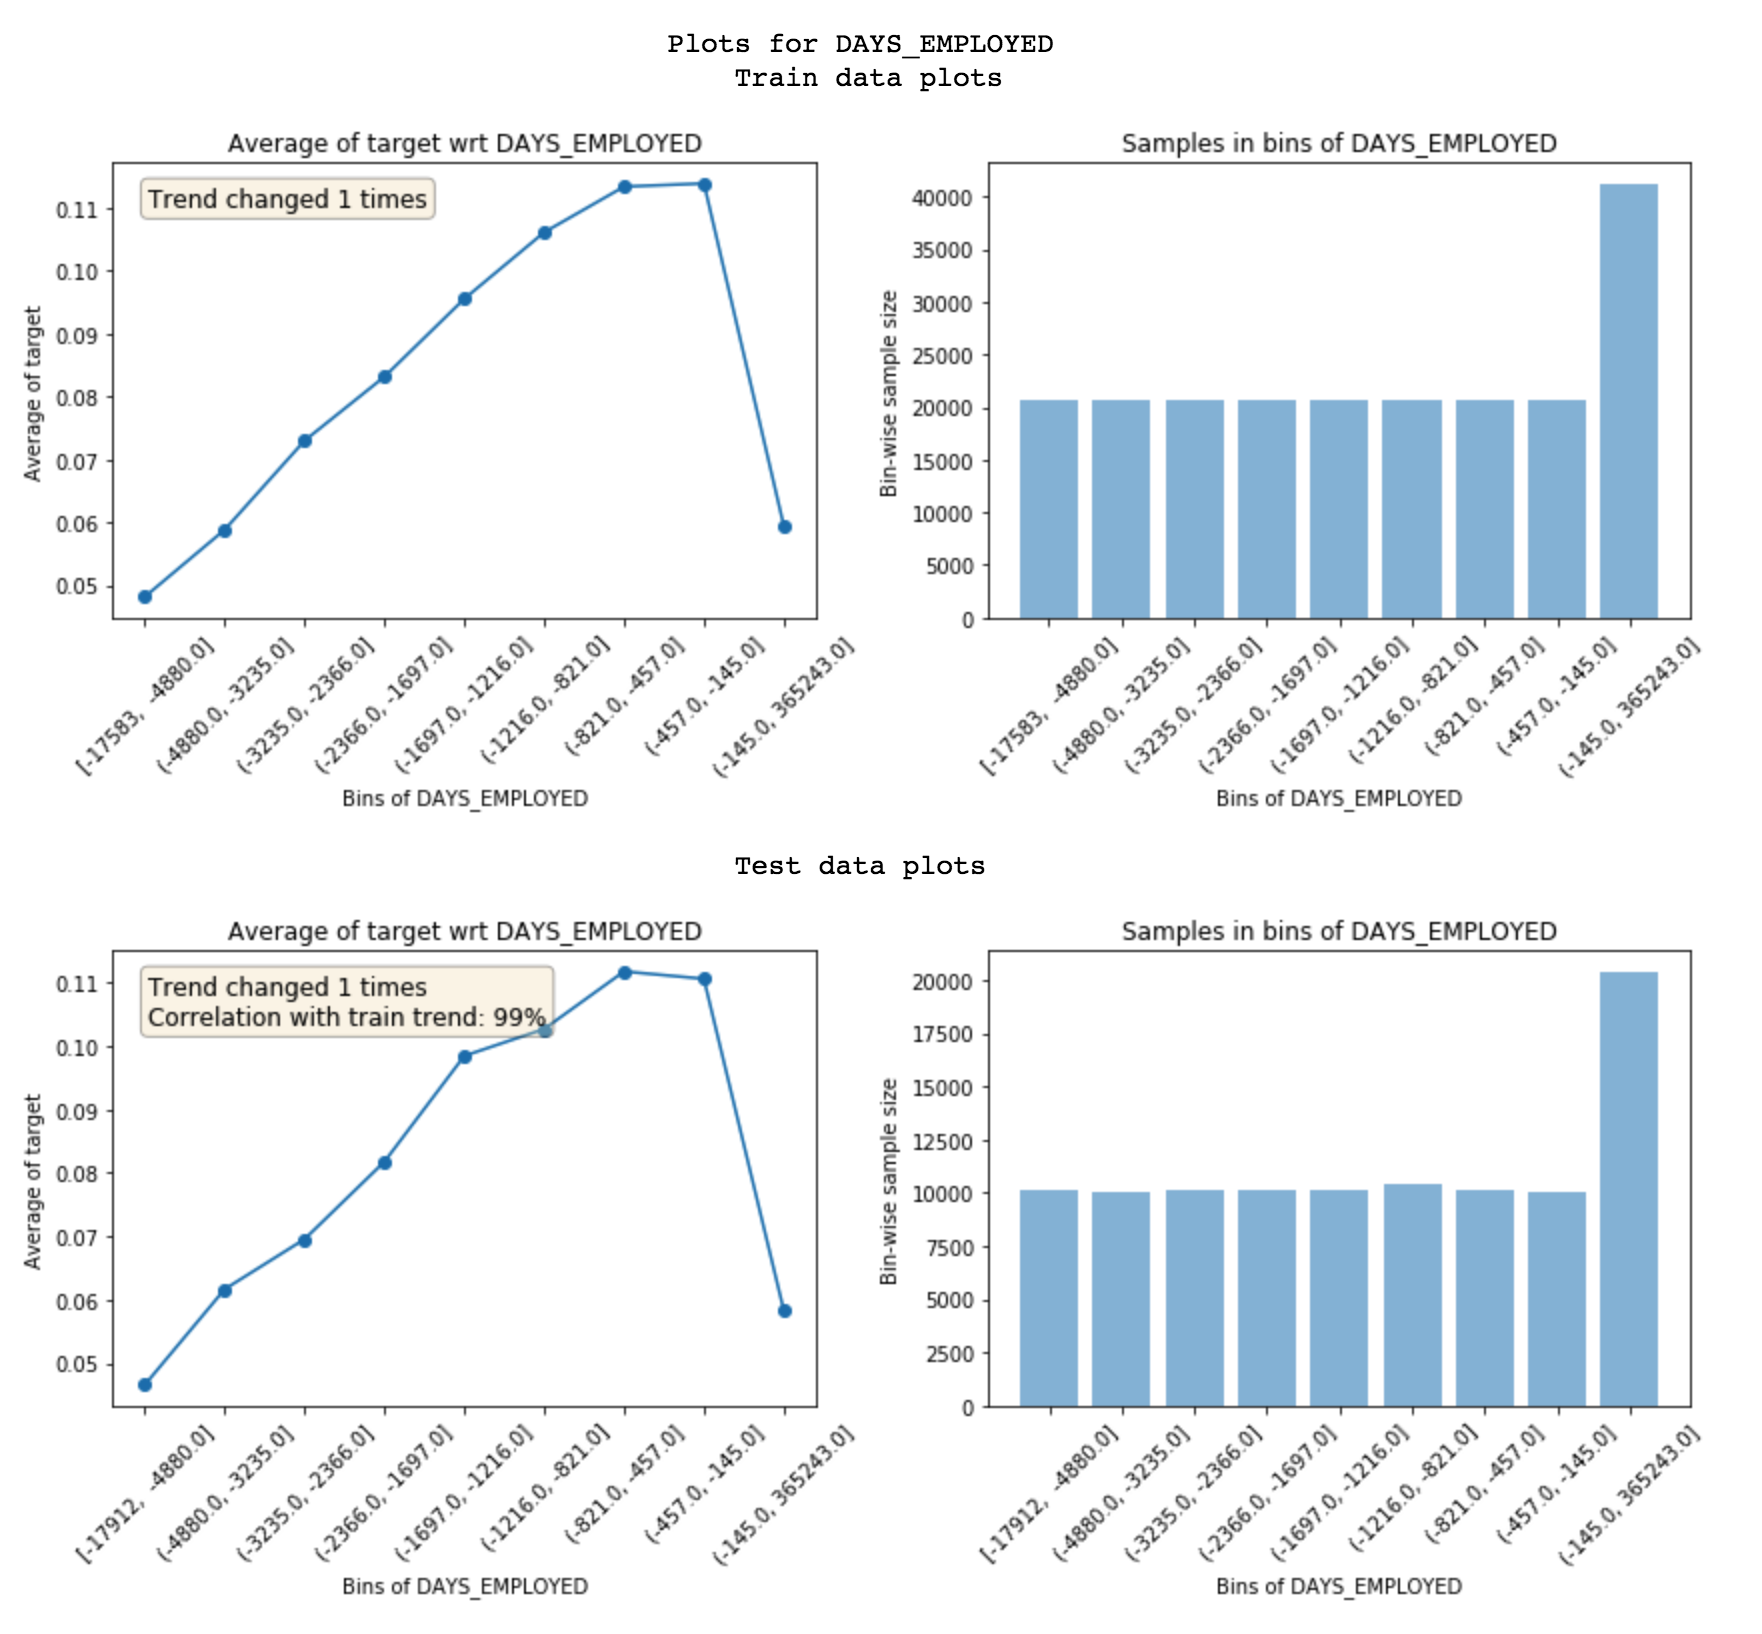 featexp bins a feature into equal population bins and shows the mean value of the dependent variable (target) in each bin. Here's how to read these plots:
- The trend plot on the left helps you understand the relationship between target and feature.
- Population distribution helps you make sure the feature is correct.
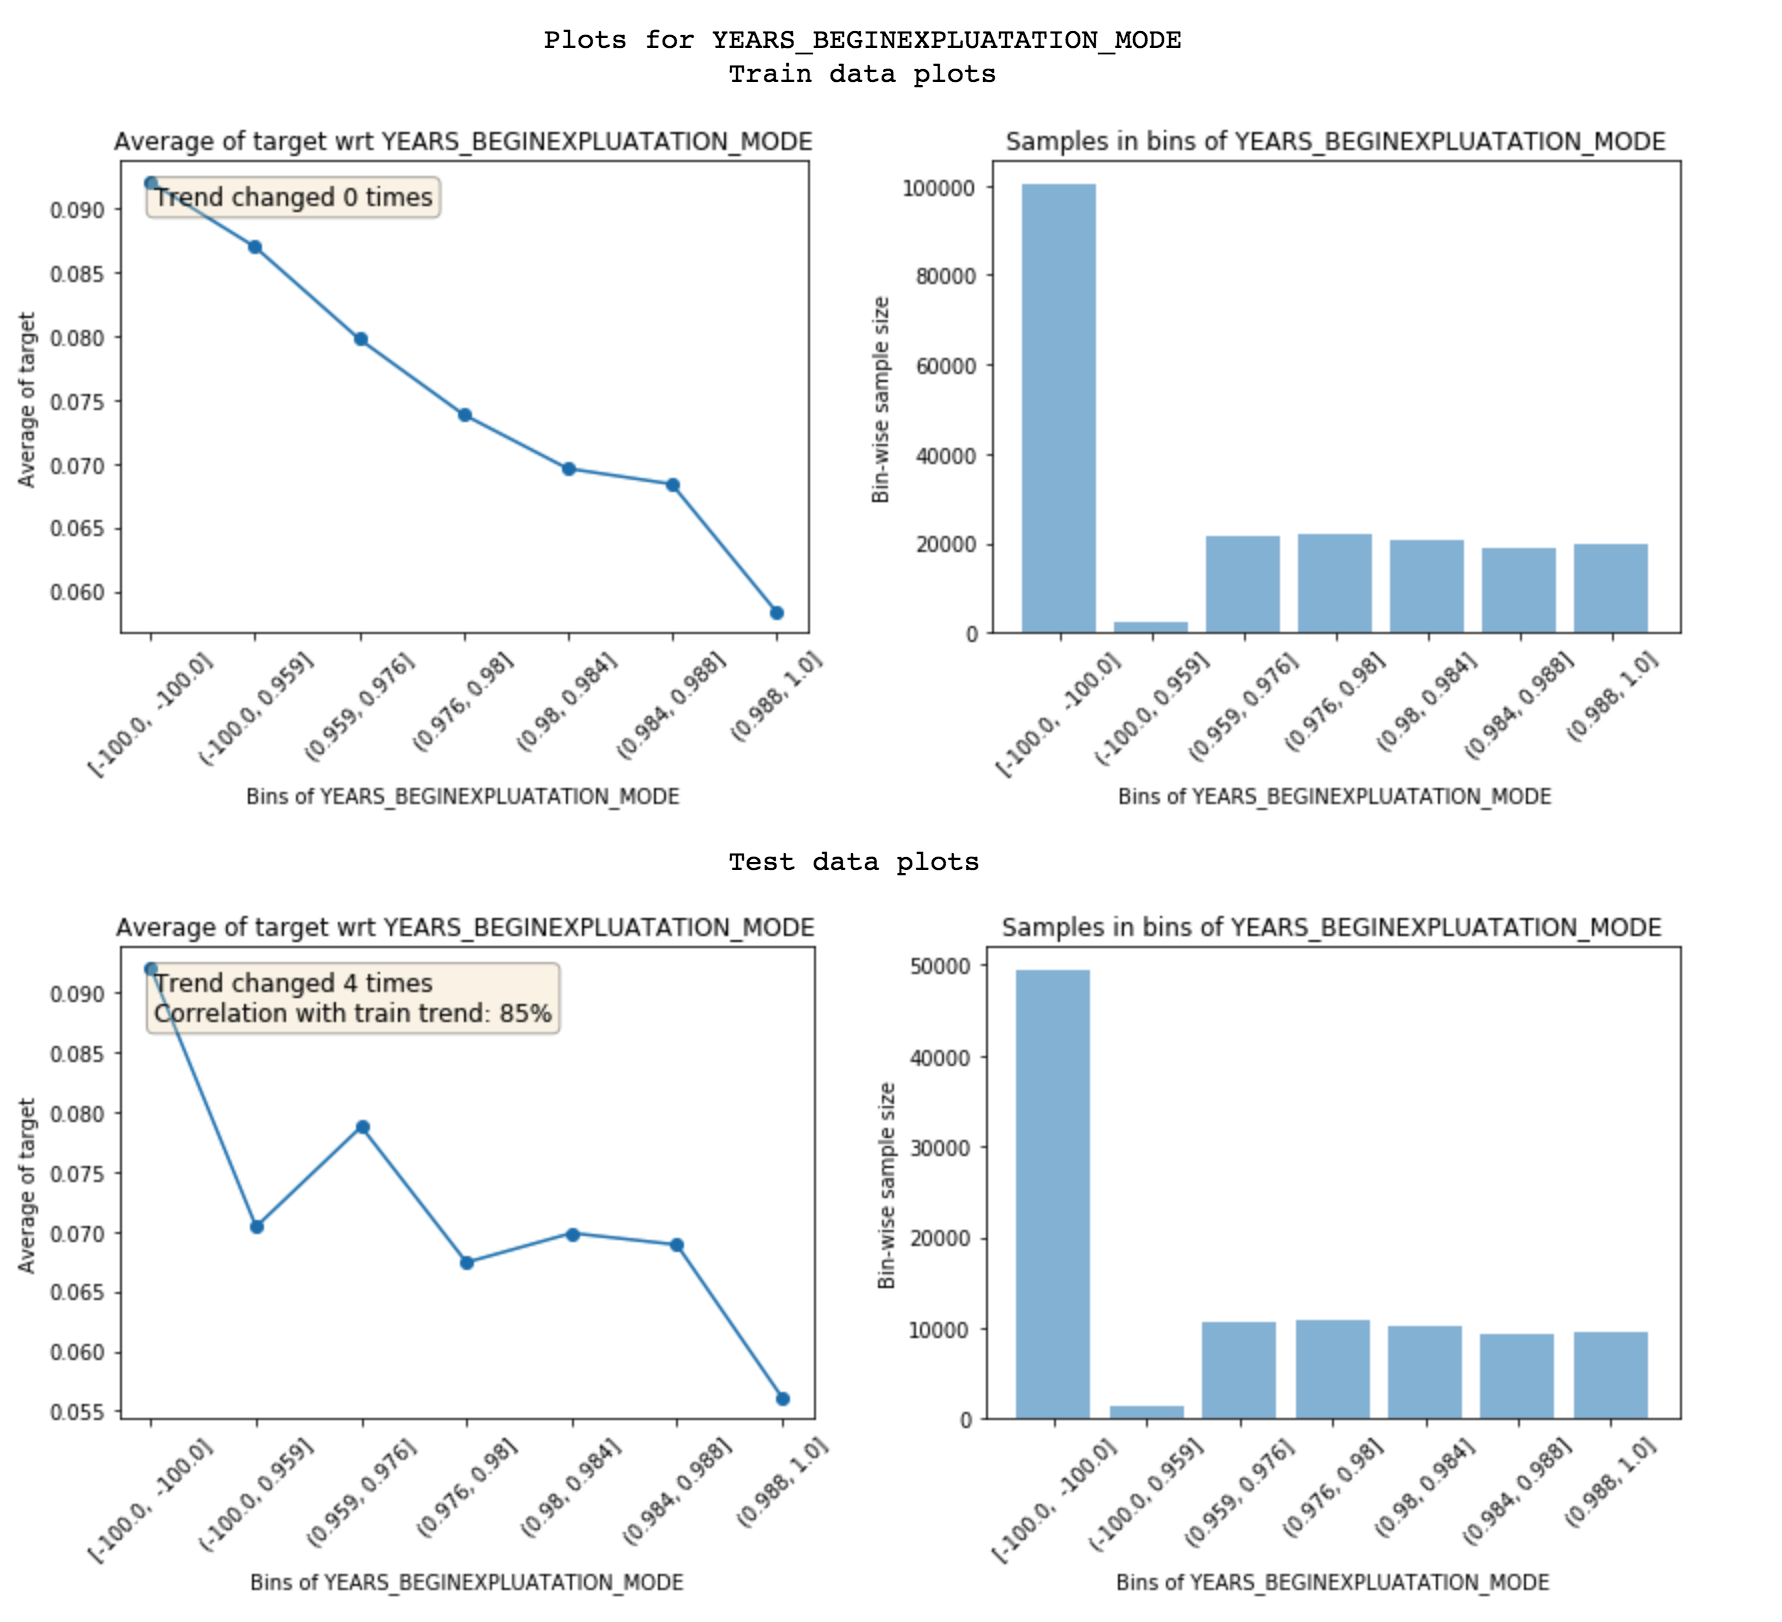
- Also, shows the number of trend direction changes and the correlation between train and test trend which can be used to identify noisy features. A high number of trend changes or low trend correlation implies high noise.
Example of a noisy feature: Has low trend correlation
Getting binned feature stats
Returns mean target and population in each bin of a feature
from featexp import univariate_plotter
binned_data_train, binned_data_test = univariate_plotter(data=data_train, target_col='target', feature='DAYS_EMPLOYED', data_test=data_test)
# For only train data
binned_data_train = univariate_plotter(data=data_train, target_col='target', feature='DAYS_EMPLOYED')
Getting stats for all features
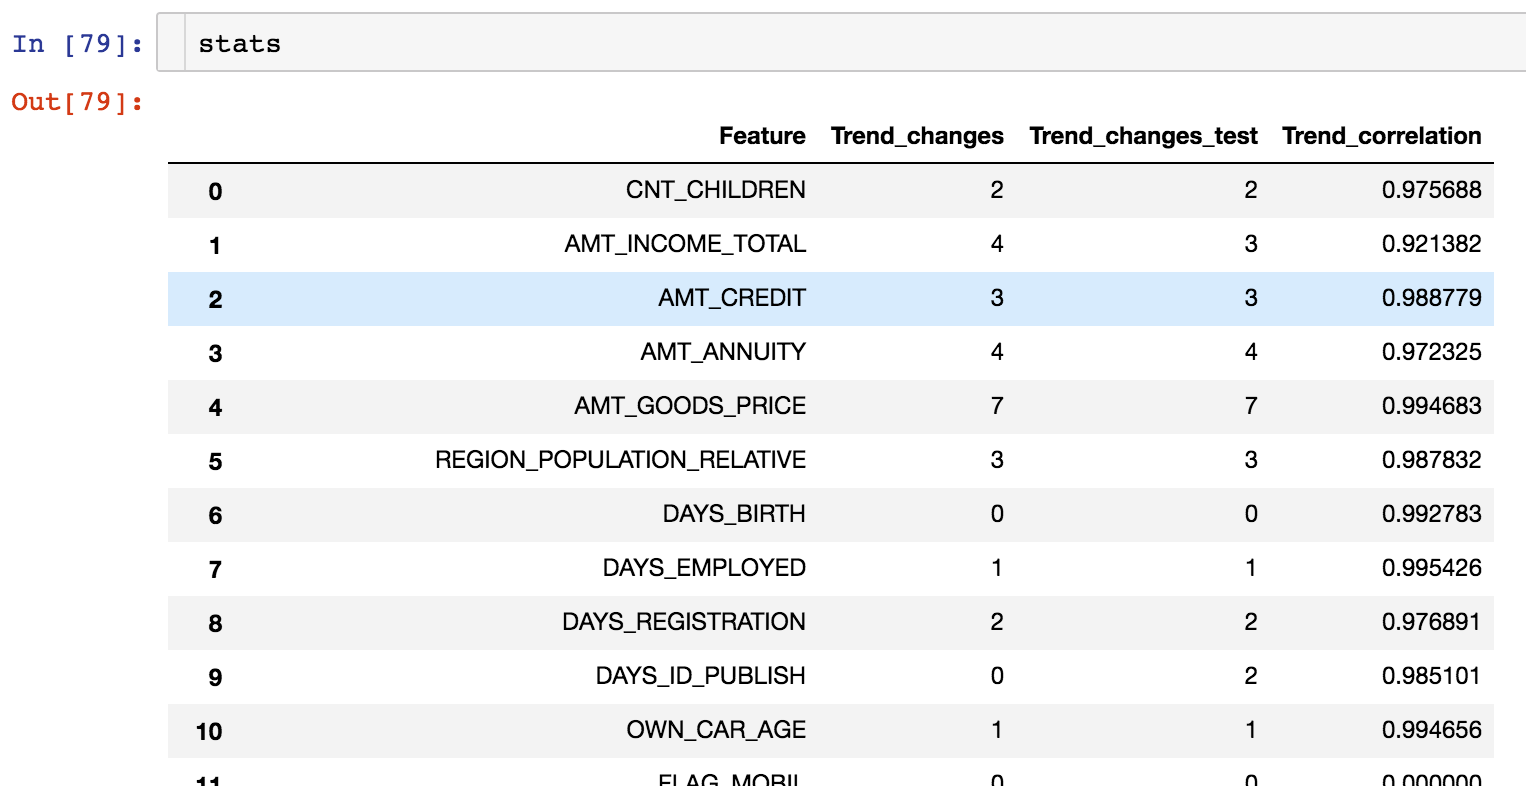
Returns trend changes and trend correlation for all features in a dataframe
from featexp import get_trend_stats_feature
stats = get_trend_stats(data=data_train, target_col='target', data_test=data_test)

# data_test is optional. If not passed, trend correlations aren't calculated.
Returns a dataframe with trend changes and trend correlation which can be used for dropping the noisy features, etc.
Leakage detection
It helps with identifying why a feature is leaky which helps with debugging.
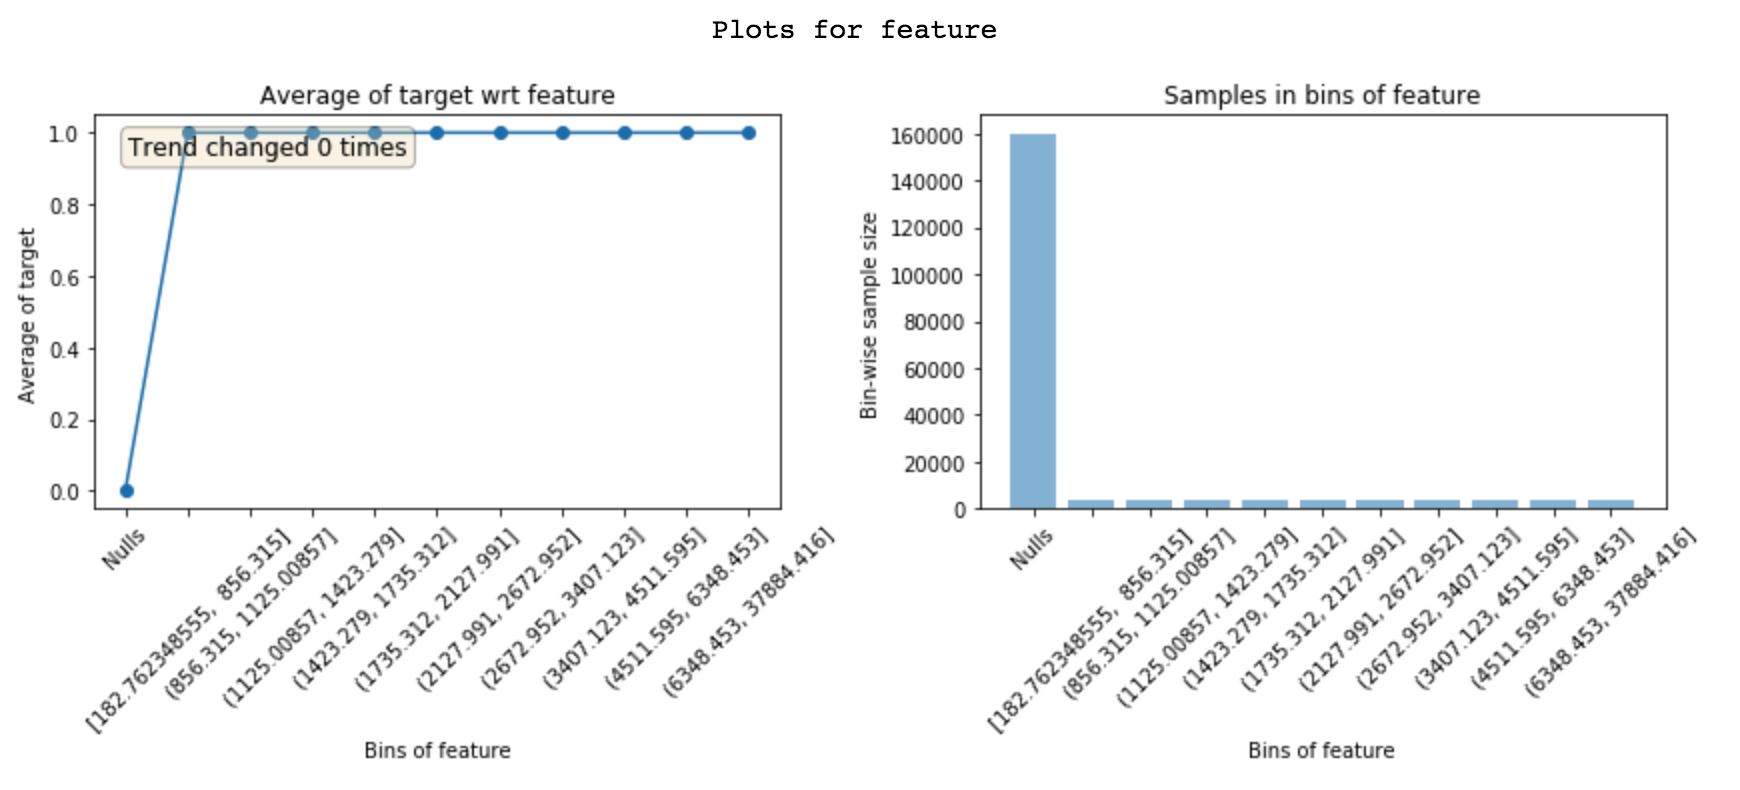 Nulls have 0% mean target and 100% mean target in other bins. Implies this feature is populated only for target = 1.
Citing featexp
