"The Elements of Statistical Learning" Notebooks
Reproducing examples from the "The Elements of Statistical Learning" by Trevor Hastie, Robert Tibshirani and Jerome Friedman with Python and its popular libraries: numpy, math, scipy, sklearn, pandas, tensorflow, statsmodels, sympy, catboost, pyearth, mlxtend, cvxpy. Almost all plotting is done using matplotlib, sometimes using seaborn.
Examples
The documented Jupyter Notebooks are in the examples folder:
examples/Mixture.ipynb
Classifying the points from a mixture of "gaussians" using linear regression, nearest-neighbor, logistic regression with natural cubic splines basis expansion, neural networks, support vector machines, flexible discriminant analysis over MARS regression, mixture discriminant analysis, k-Means clustering, Gaussian mixture model and random forests.

examples/Prostate Cancer.ipynb
Predicting prostate specific antigen using ordinary least squares, ridge/lasso regularized linear regression, principal components regression, partial least squares and best subset regression. Model parameters are selected by K-folds cross-validation.

examples/South African Heart Disease.ipynb
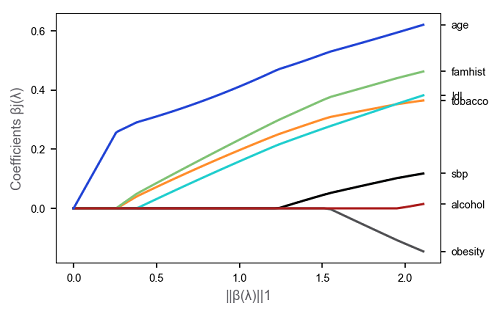
Understanding the risk factors using logistic regression, L1 regularized logistic regression, natural cubic splines basis expansion for nonlinearities, thin-plate spline for mutual dependency, local logistic regression, kernel density estimation and gaussian mixture models.
examples/Vowel.ipynb
Vowel speech recognition using regression of an indicator matrix, linear/quadratic/regularized/reduced-rank discriminant analysis and logistic regression.

examples/Bone Mineral Density.ipynb
Comparing patterns of bone mineral density relative change for men and women using smoothing splines.

examples/Air Pollution Data.ipynb
Analysing Los Angeles pollution data using smoothing splines.

examples/Phoneme Recognition.ipynb
Phonemes speech recognition using reduced flexibility logistic regression.

examples/Galaxy.ipynb
Analysing radial velocity of galaxy NGC7531 using local regression in multidimentional space.

examples/Ozone.ipynb
Analysing the factors influencing ozone concentration using local regression and trellis plot.

examples/Spam.ipynb
Detecting email spam using logistic regression, generalized additive logistic model, decision tree, multivariate adaptive regression splines, boosting and random forest.

examples/California Housing.ipynb
Analysing the factors influencing California houses prices using boosting over decision trees and partial dependance plots.

examples/Demographics.ipynb
Predicting shopping mall customers occupation, and hence identifying demographic variables that discriminate between different occupational categories using boosting and market basket analysis.

examples/ZIP Code.ipynb
Recognizing small hand-drawn digits using LeCun's Net-1 - Net-5 neural networks.

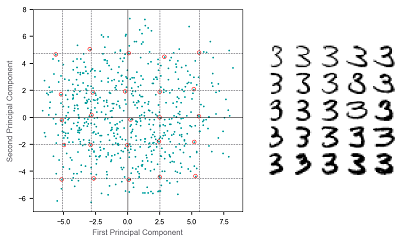
Analysing of the number three variation in ZIP codes using principal component and archetypal analysis.
examples/Human Tumor Microarray Data.ipynb
Analysing microarray data using K-means clustring and hierarchical clustering.

examples/Country Dissimilarities.ipynb
Analysing country dissimilarities using K-medoids clustering and multidimensional scaling.

examples/Signature.ipynb
Analysing signature shapes using Procrustes transformation.

examples/Waveform.ipynb
Recognizing wave classes using linear, quadratic, flexible (over MARS regression), mixture discriminant analysis and decision trees.

examples/Protein Flow-Cytometry.ipynb
Analysing protein flow-cytometry data using graphical-lasso undirected graphical model for continuous variables.

examples/SRBCT Microarray.ipynb
Analysing microarray data of 2308 genes and selecting the most significant genes for cancer classification using nearest shrunken centroids.

examples/14 Cancer Microarray.ipynb
Analysing microarray data of 16,063 genes gathered by Ramaswamy et al. (2001) and selecting the most significant genes for cancer classification using nearest shrunken centroids, L2-penalized discriminant analysis, support vector classifier, k-nearest neighbors, L2-penalized multinominal, L1-penalized multinominal and elastic-net penalized multinominal. It is a difficult classification problem with p>>N (only 144 training observations).
examples/Skin of the Orange.ipynb
Solving a synthetic classification problem using Support Vector Machines and multivariate adaptive regression splines to show the influence of additional noise features.
examples/Radiation Sensitivity.ipynb
Assessing the significance of 12,625 genes from microarray study of radiation sensitivity using Benjamini-Hochberg method and the significane analysis of microarrays (SAM) approach.
