Check CX
When your AI API goes down, you should be the first to know.
English | 简体中文
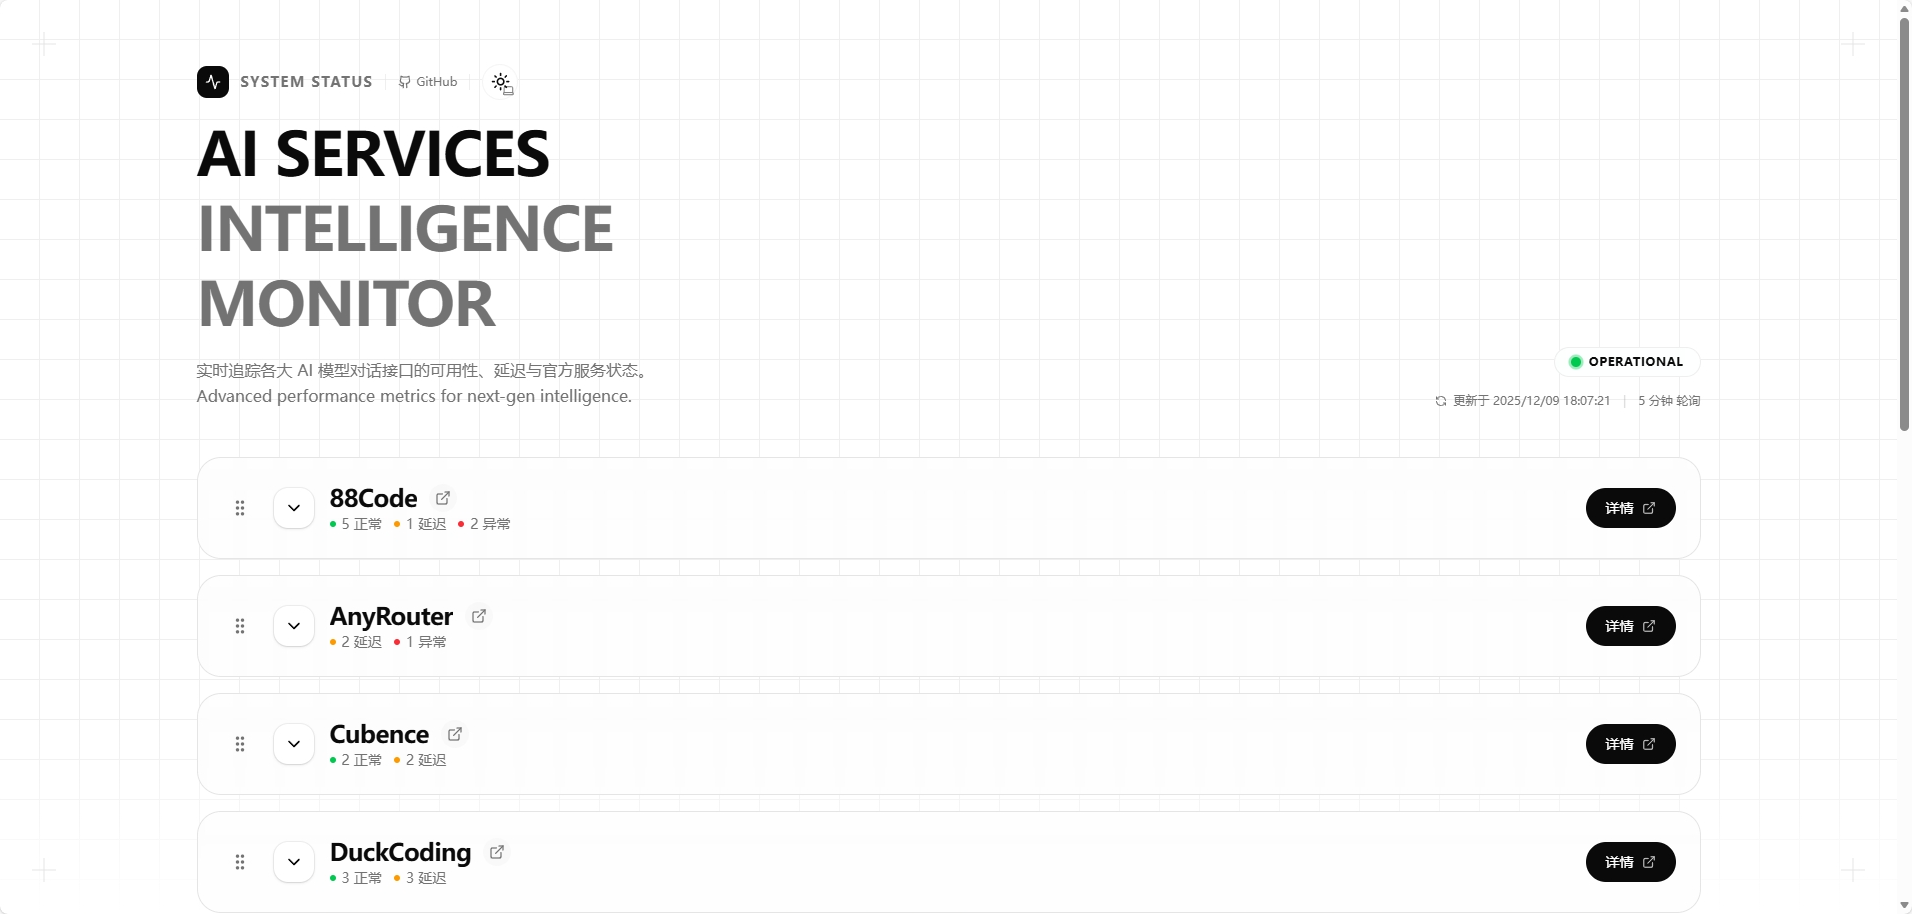
Check CX continuously probes the availability and latency of AI model APIs like OpenAI / Gemini / Anthropic, and turns the results into a clear, shareable status board — outages become visible instantly, slowness becomes provable.
Why Check CX
- Relay providers are flaky, and you never know which hop is the problem. Check CX sends real model requests, measuring end-to-end availability — not just whether the port answers.
- Some relays return fake responses to fool health checkers. Every Check CX probe is a randomly generated language challenge; a wrong answer marks the endpoint as down — canned-text fake proxies can't hide.
- When users report issues, you need evidence. 7/15/30-day uptime stats and a history timeline turn "occasional timeouts" into a quantifiable curve.
- You need a status page you can put on your site. Grouped views, website links, and a public read-only status API — works out of the box.
Highlights
🩺 Real-Request Health Checks
No fake probes — every check is a real streaming model call, capturing the true time-to-first-token (immune to endpoints streaming empty chunks to fake latency) plus endpoint ping latency. Supports both Chat Completions and Responses endpoints; Gemini is auto-detected between the native Google API and OpenAI-compatible formats; reasoning models like o1 / GPT-5 / DeepSeek-R1 / QwQ automatically get reasoning-effort configuration.
🧠 Random Challenge Validation — Built to Catch Fake Relays
Each check generates a fresh language challenge on the fly (category selection, reading comprehension, state tracking, logical implication, instruction following — 5 difficulty tiers) and requires the model to produce the one correct answer. Random guessing almost never passes — proxies that return canned text get exposed on the spot.
📊 Model Capability Assessment
Health checks also sample high-difficulty challenges (tiers 3–5), shown as an intelligence score on each card, with per-tier pass rates on hover. Failing a hard challenge affects the capability score, not the health status — weak models don't flap, but capability differences are visible at a glance.
📈 History Timeline & Uptime Stats
Every model card has a response-time timeline and 7/15/30-day uptime stats, so you can instantly tell "rock solid" from "occasionally flaky".
🔄 Live Config Reload
Changed a model config in the admin panel? The frontend watches for config changes over SSE and refreshes automatically — no F5 required.
🗂️ Grouped Views
Group models by provider or relay, each group with its own tags and website link, plus a dedicated group detail page. A hundred models still stay tidy.
📢 Official Status Sync
Automatically polls the official status pages of OpenAI and Anthropic — if your own probes are all green but the provider is having an incident, the cause is obvious.
🛠️ Maintenance Mode & Notification Banners
Taking a model offline for maintenance? Enable maintenance mode: the card stays, polling stops, and status no longer turns red. Supports multiple Markdown notification banners in rotation (info / warning / error levels) — enough for maintenance and change announcements.
🌐 Read-Only Status API
GET /api/v1/status returns structured status data — hook it up to uptime robots, alerting bots, or your own systems.
🎨 Dark Mode
One-click light/dark theme toggle, follows your system preference automatically.
🏗️ Production-Ready Design
- Multi-node deployments auto-elect a leader (via database leases) — run as many replicas as you like without duplicate polling.
- Automatic retries on network hiccups — transient aborts never cause false alarms.
- API keys live only in the database and are read only server-side — never in the frontend or config files.
- History data is pruned automatically by retention days.
Getting Started
One-Command Stack (Docker, Recommended)
docker-compose.yml bundles the full self-hosted Supabase stack (Postgres, PostgREST, GoTrue, Storage, Realtime, Studio, API gateway) plus the Check CX panel and admin panel. Tables are auto-created on first start — no cloud Supabase project, no manual SQL.
git clone https://github.com/BingZi-233/check-cx.git
cd check-cx
cp .env.example .env
docker compose up -d
Open:
- Panel
http://localhost:3000— works with zero config - Admin
http://localhost:3001— sign-in requires GitHub OAuth (see below) - Supabase API
http://localhost:8000
All knobs live in .env (annotated, copy of the upstream Supabase .env.example plus Check CX variables).
Port exposure and non-default ports
The default stack publishes only the panel and Supabase API/Auth to the network. The admin panel is loopback-only, while Postgres and the transaction pooler stay inside the Docker network.
| Service | Default binding | Variable |
|---|---|---|
| Panel | 0.0.0.0:3000 |
CHECK_CX_BIND_ADDRESS, CHECK_CX_PORT |
| Admin | 127.0.0.1:3001 |
ADMIN_BIND_ADDRESS, ADMIN_PORT |
| Supabase API / Auth | 0.0.0.0:8000 |
API_GW_BIND_ADDRESS, API_GW_HTTP_PORT (or KONG_HTTP_PORT) |
| Postgres | not published | opt in with docker-compose.db-access.yml |
| Transaction pooler | not published | opt in with docker-compose.db-access.yml |
Use a host reverse proxy for remote admin access. Directly exposing the admin panel requires an explicit ADMIN_BIND_ADDRESS=0.0.0.0. If a reverse proxy also fronts Supabase Auth, set API_GW_BIND_ADDRESS=127.0.0.1 and make SUPABASE_URL the proxy URL reachable by both the admin server and the browser.
For example, this local profile avoids common conflicts. Container ports stay unchanged; every browser-visible URL must use the matching host port.
CHECK_CX_PORT=13000
ADMIN_PORT=13001
API_GW_HTTP_PORT=18000

SUPABASE_PUBLIC_URL=http://localhost:18000
API_EXTERNAL_URL=http://localhost:18000/auth/v1
SITE_URL=http://localhost:13001
ADDITIONAL_REDIRECT_URLS=http://localhost:13001/auth/callback
APP_URL=http://localhost:13001
Leave SUPABASE_URL empty for the bundled local stack: Compose selects the right internal or host-gateway URL, including a customized API port. For LAN/public deployment, set it to the browser-reachable external Supabase API URL. Validate the resolved configuration before starting:
docker compose config -q
docker compose up -d
For temporary host-side SQL access, use the opt-in override. It binds both database ports to loopback only:
docker compose -f docker-compose.yml -f docker-compose.db-access.yml up -d
Updating an existing bundled stack
Use ./deploy.sh for a fast-forward update. It applies newly added public database migrations before replacing the application containers, refuses modified/deleted migration history, and checks the actual panel port. External Supabase projects remain manual: apply the migrations in docs/OPERATIONS.md before deploying.
Enabling admin sign-in
Admin authenticates via Supabase Auth with GitHub OAuth. Create a GitHub OAuth app with callback URL http://:/auth/v1/callback (default: http://localhost:8000/auth/v1/callback), then set in .env:
GITHUB_ENABLED=true
GITHUB_CLIENT_ID=...
GITHUB_SECRET=...
[email protected]
# 同机访问可保持默认;局域网/公网访问改为 http://<主机IP或域名>:3001
APP_URL=http://localhost:3001
Production deployment
The stack ships with public demo JWTs and passwords — replace them before exposing to any network. Generate production secrets with the vendored upstream helpers, then set in .env:
sh docker/supabase-stack/utils/generate-keys.sh # JWT_SECRET / ANON_KEY / SERVICE_ROLE_KEY 等
At minimum change: POSTGRES_PASSWORD, JWT_SECRET, ANON_KEY, SERVICE_ROLE_KEY, DASHBOARD_USERNAME/PASSWORD, SECRET_KEY_BASE, VAULT_ENC_KEY, PG_META_CRYPTO_KEY. For LAN/public access also set SUPABASE_PUBLIC_URL, API_EXTERNAL_URL, APP_URL and SUPABASE_URL to your host address.
Already using a cloud Supabase project? Set SUPABASE_URL and your keys in .env — the panel and admin will keep using the cloud database (the bundled Supabase services simply sit idle).
Local Development
Requirements: Node.js >= 22, pnpm 10, and a Supabase project.
pnpm install
cp .env.example .env.dev   # Note: pnpm dev reads .env.dev
pnpm dev
First run: initialize the database and add monitoring configs.
- Run
supabase/schema.sqlto create tables (for existing databases, runsupabase/migrations/in order). - Add models and configs (sample SQL below, or just use the admin panel).
-- 1) Create the model first
INSERT INTO check_models (type, model)
VALUES ('openai', 'gpt-4o-mini')
ON CONFLICT (type, model) DO NOTHING;

-- 2) Then create the config instance
INSERT INTO check_configs (name, type, model_id, endpoint, api_key, enabled)
SELECT 'OpenAI GPT-4o', 'openai', id,
       'https://api.openai.com/v1/chat/completions',
       'sk-your-api-key', true
FROM check_models
WHERE type = 'openai' AND model = 'gpt-4o-mini';
Admin Panel
No SQL needed for day-to-day maintenance of models, configs, groups, and notifications — use the companion admin panel check-cx-admin (GitHub OAuth login, same Supabase database).
Configuration Reference
Environment Variables
| Variable | Required | Default | Description |
|---|---|---|---|
SUPABASE_URL |
Yes | - | Supabase project URL |
SUPABASE_PUBLISHABLE_OR_ANON_KEY |
Yes | - | Supabase publishable / anon key |
SUPABASE_SERVICE_ROLE_KEY |
Yes | - | Service Role Key (server-side only, never expose) |
CHECK_NODE_ID |
No | local |
Node identity, used for multi-node leader election |
CHECK_POLL_INTERVAL_SECONDS |
No | 60 |
Poll interval (15–600s) |
CHECK_CONCURRENCY |
No | 5 |
Max concurrency (1–20) |
OFFICIAL_STATUS_CHECK_INTERVAL_SECONDS |
No | 300 |
Official status poll interval (60–3600s) |
HISTORY_RETENTION_DAYS |
No | 30 |
History retention days (7–365) |
Status API
GET /api/dashboard?trendPeriod=7d|15d|30d— Dashboard aggregate data (with ETag)GET /api/group/[groupName]?trendPeriod=7d|15d|30d— Group detail dataGET /api/v1/status?group=...&model=...— Public read-only status API